
Introduction
This documentaion will explain how to use the various component of Open Innovation platform. The component of service creation platform are as follows:
- Service creation platform - For Creating IoT Application.
- Service Exchange platform - For exposing the developed IoT application to third party.
Sending Data to the Service Creation platform
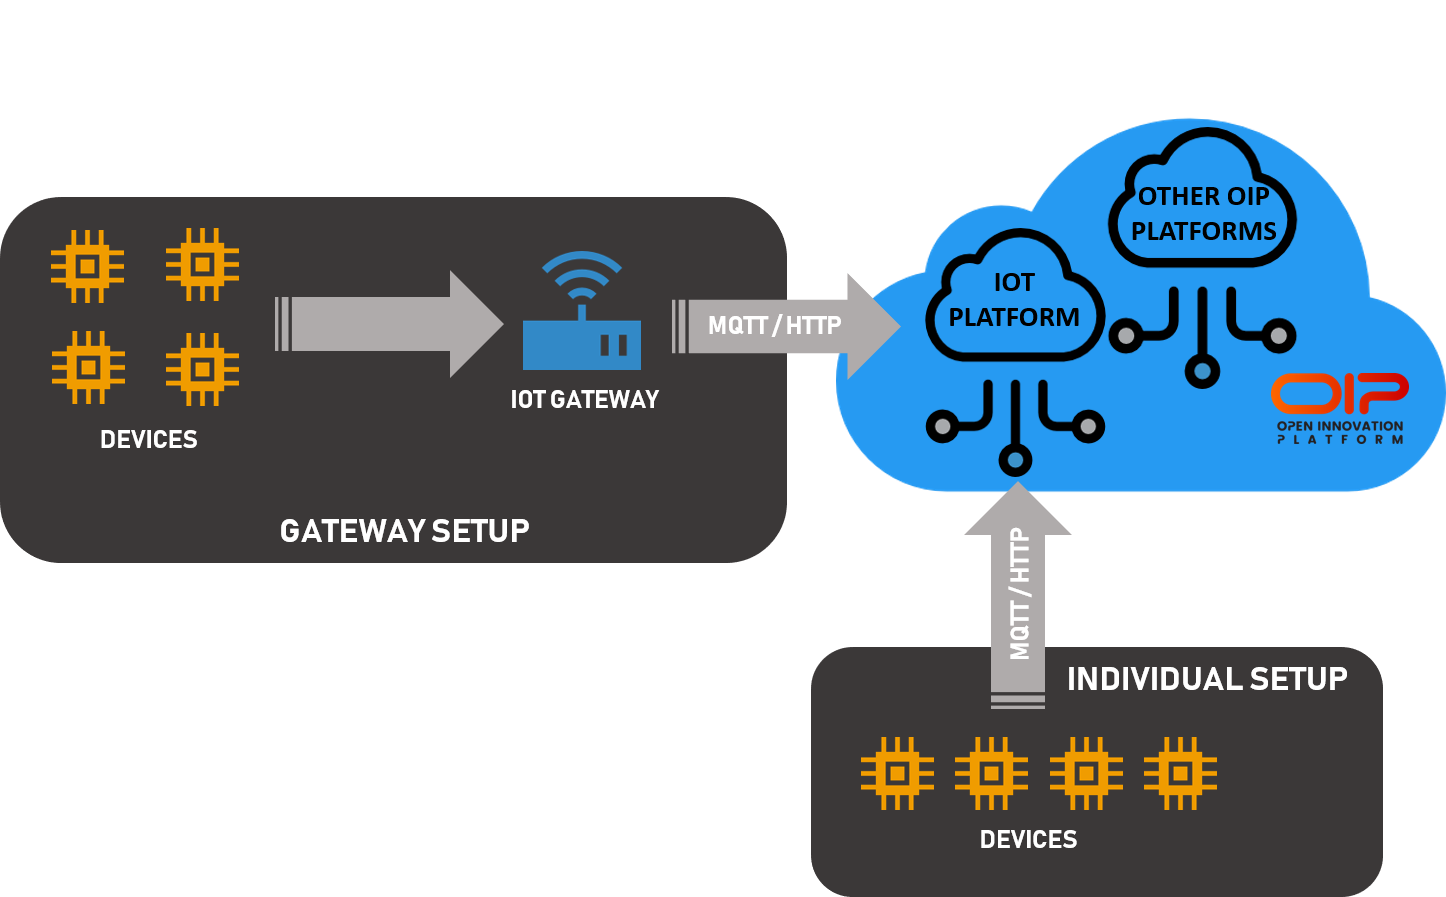
Service Creation platform helps you to create your own IoT service which can be published to the OIP Service Platform for others to subscribe. In order to provide the data to others, your device(s) should start sending the data to the Service Creation platform. A device can individually sends data to the Service Creation platform or through a gateway. There are two ways of sending data to the Service Creation platform, which is via MQTT or HTTPS protocol.
Preparation
In this tutorial, we are going to send temperature and humidity data to the Service Creation platform in JSON format.
Data to send in JSON
[
  {
    temp: 70,
    humidity: 65
  }
]
The API endpoint for receiving data from the device is iot.oip.tm.com.my
Besides that, a unique access token is required for the platform to recognize the device. This access token can be obtained from theService Creation platform console.

Sending data via MQTT
As an example, we are using Mosquitto as the MQTT client. You can use any MQTT client of your liking. With all the parameters that we have in the preparation section, run mosquitto_pub on the Windows command line.
# run the mosquitto publisher
mosquitto_pub -d -h "iot.oip.tm.com.my" -t "v1/devices/me/telemetry" -u "$ACCESS_TOKEN" -f "data.json"
Replace the $ACCESS_TOKEN with the device actual access token
From client point of view, a successful transmission should look like this:

Sending Data via HTTPS
Parameter wise, sending data via HTTPS is similar to MQTT. In this example, we are using Curl as the HTTP client. Simply run the cURL command on the command line.
curl -X POST \
  https://iot.oip.tm.com.my/api/v1/teiOoHIaVDAozEnikRaa/telemetry \
  -H 'Content-Type: application/json' \
  -d '[
  {
    "temp": 70,
    "humidity": 65
  }
]'
There are no HTTP response body provided by the Service Creation platform. Verification on client side can be done by simply checking the HTTP status code. A successful transmission should return status code 200.
Verifying the Data
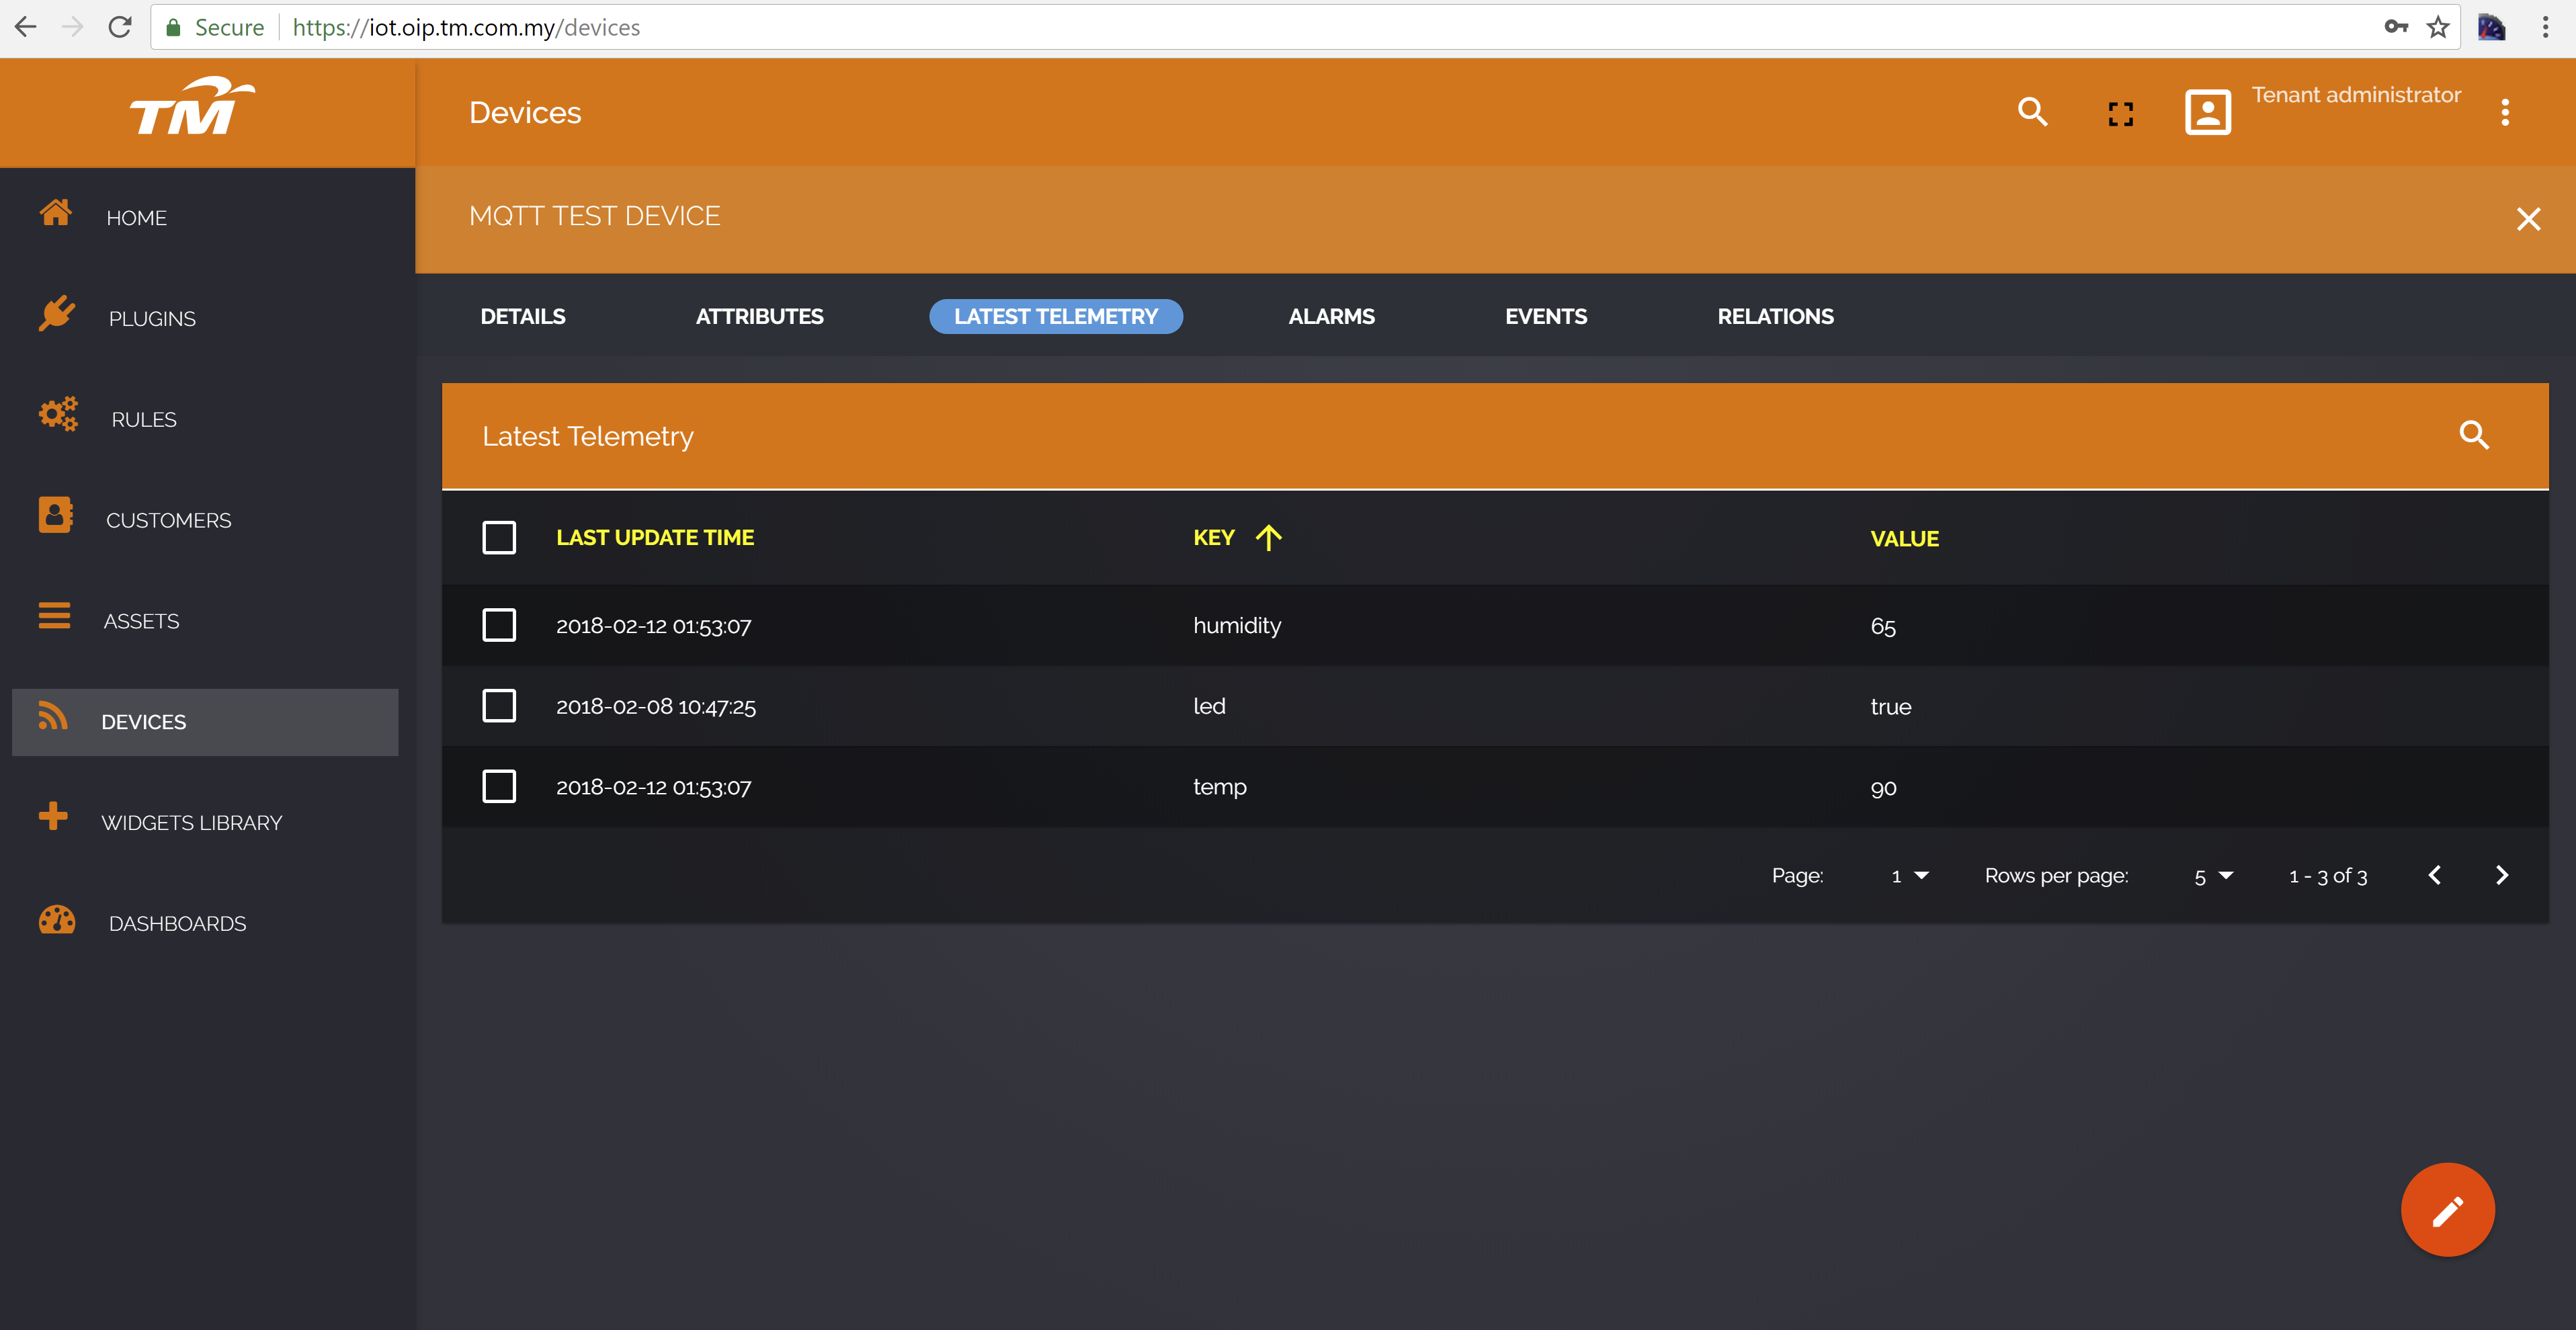
The simplest way to verify if the data has really successfully sent to the Service Creation platform is to check on the Service Creation platform console. Browse to the desired device detail and click on latest telemetry tabs. It should show the latest data that has been sent by the device.
Service Exchange Platform
Subscribe to API
You have to subscribe to an published API before using it in your applications. Subscription to an API enables you to receive access tokens and be authenticated to invoke the API.
TM Service Exchange platform offers varierty of API stores from several providers. You can browse through the API store and view the API available. The list of API store available can be found at https://store.oip.tm.com.my/stores/.
In this tutorial we will be using the APIs in the service hub store. Visit https://store.oip.tm.com.my/stores/ and click on SERVICE HUB store.

The SERVICE HUB will contain APIs from 3rd party service providers.
As an example we will demonstrate the use of Weather-API using service exchange platform. All the API will be used in the same way as desribed here.
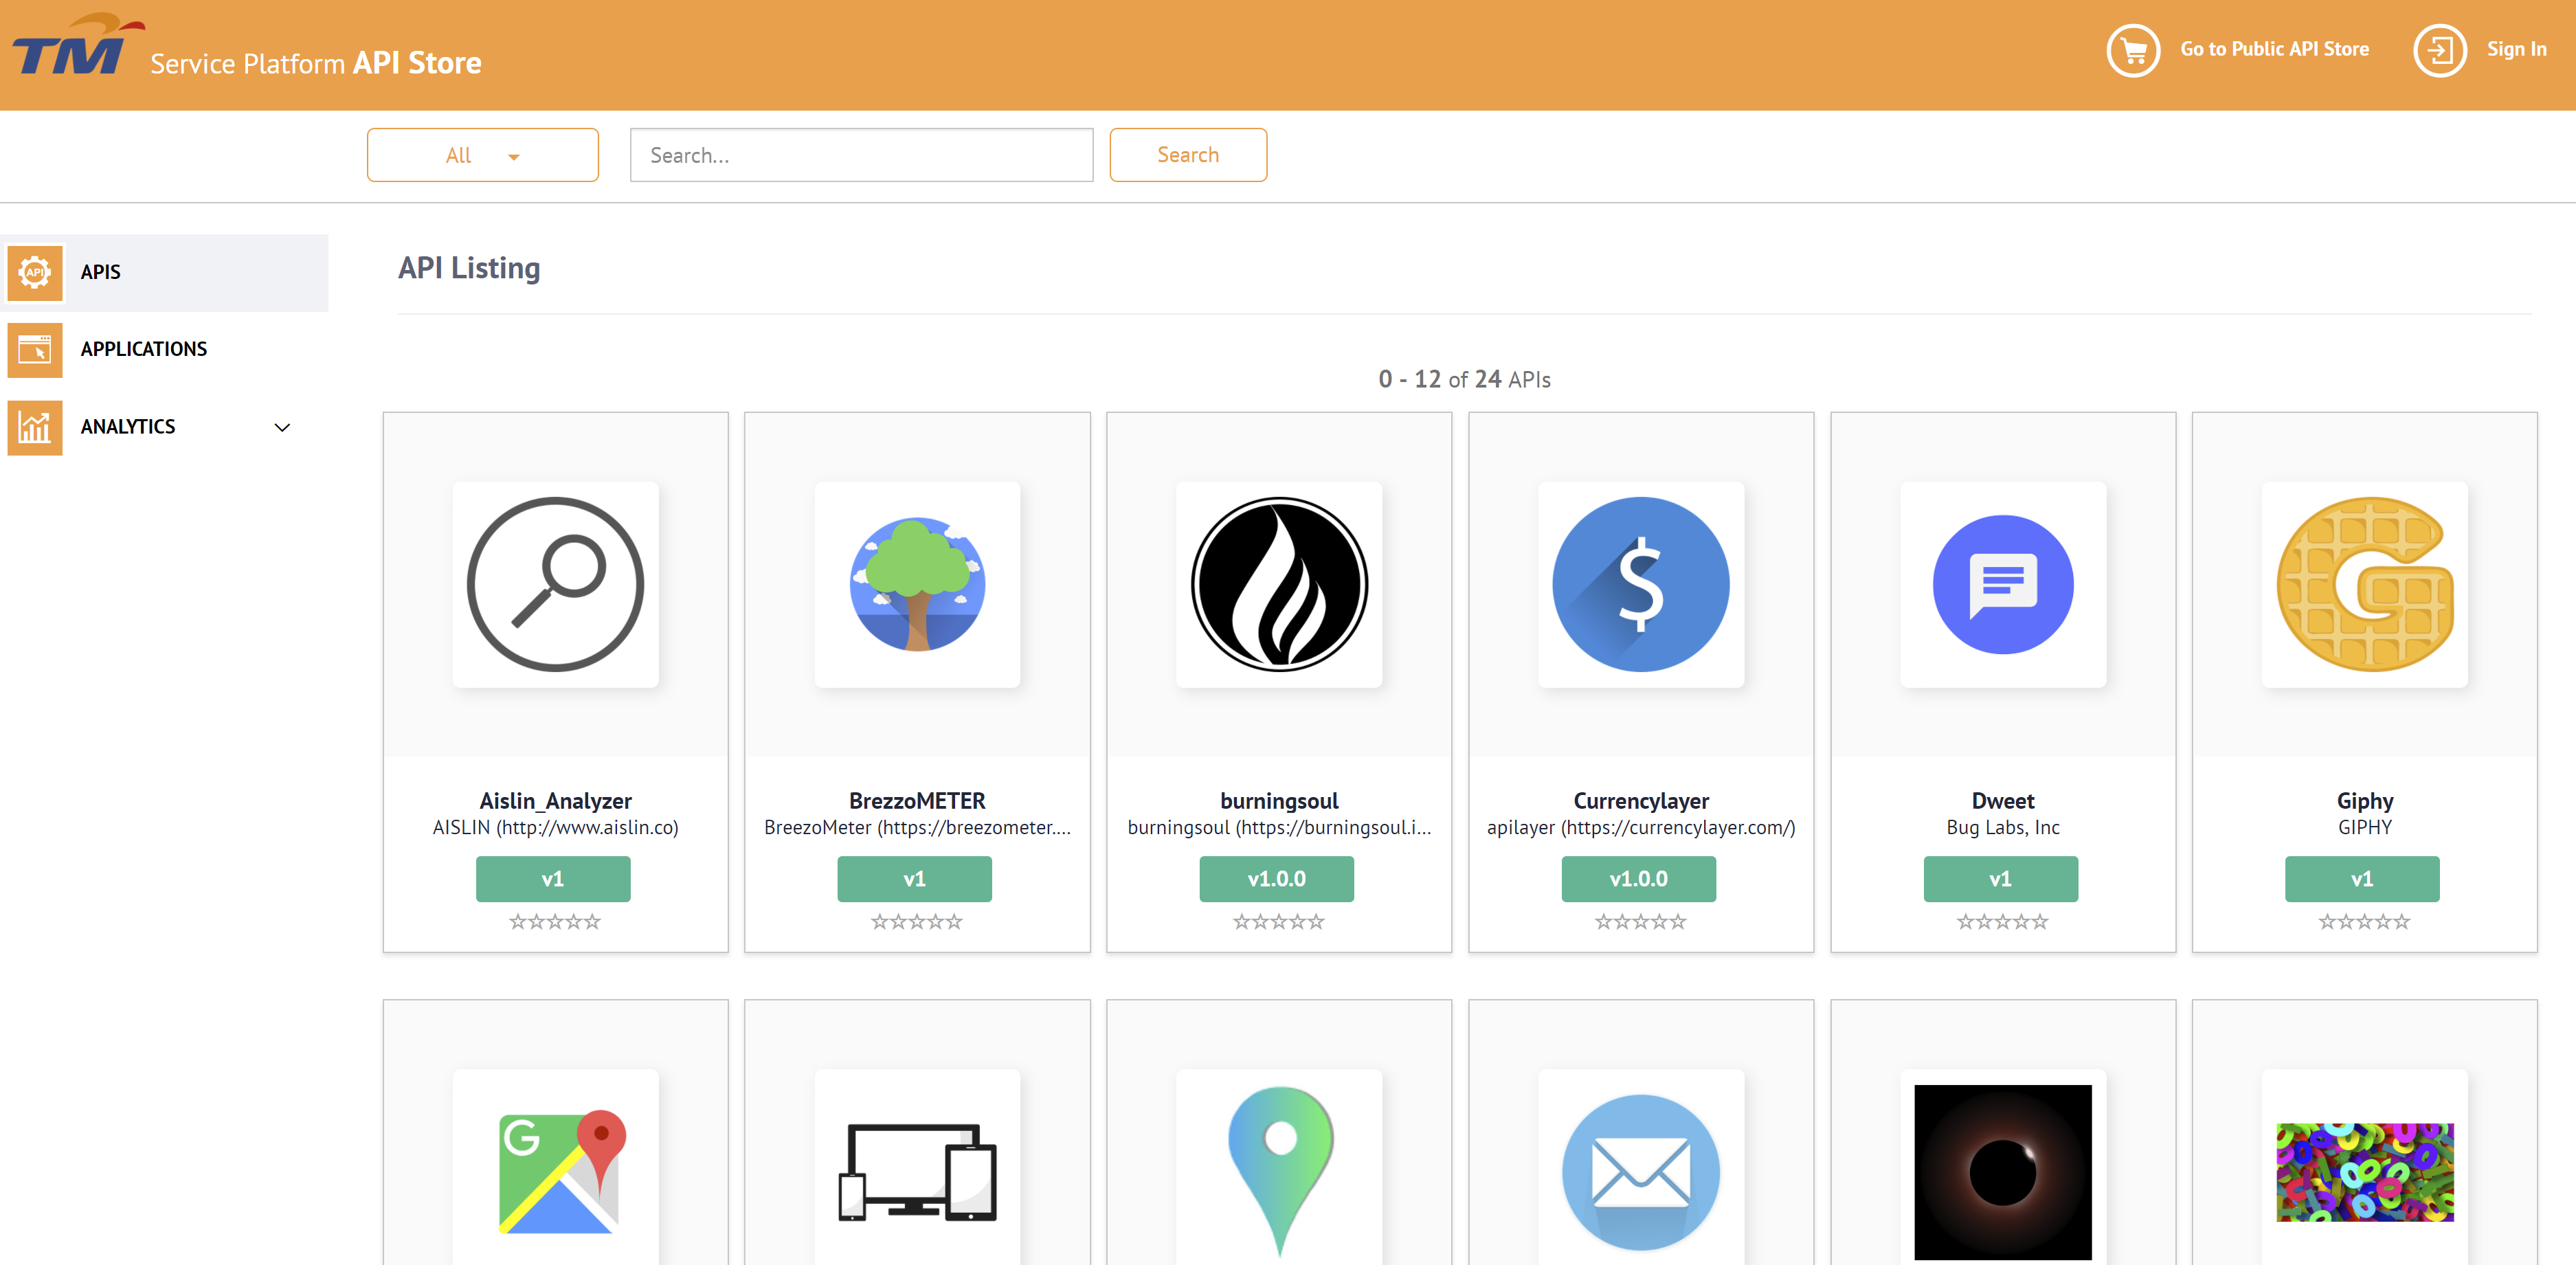
1. Sign in to the TM API Store https://store.oip.tm.com.my/apimanager/store/site/pages/login.jag and go to SERVICE HUB. In the search bar search for weather to get weather API.
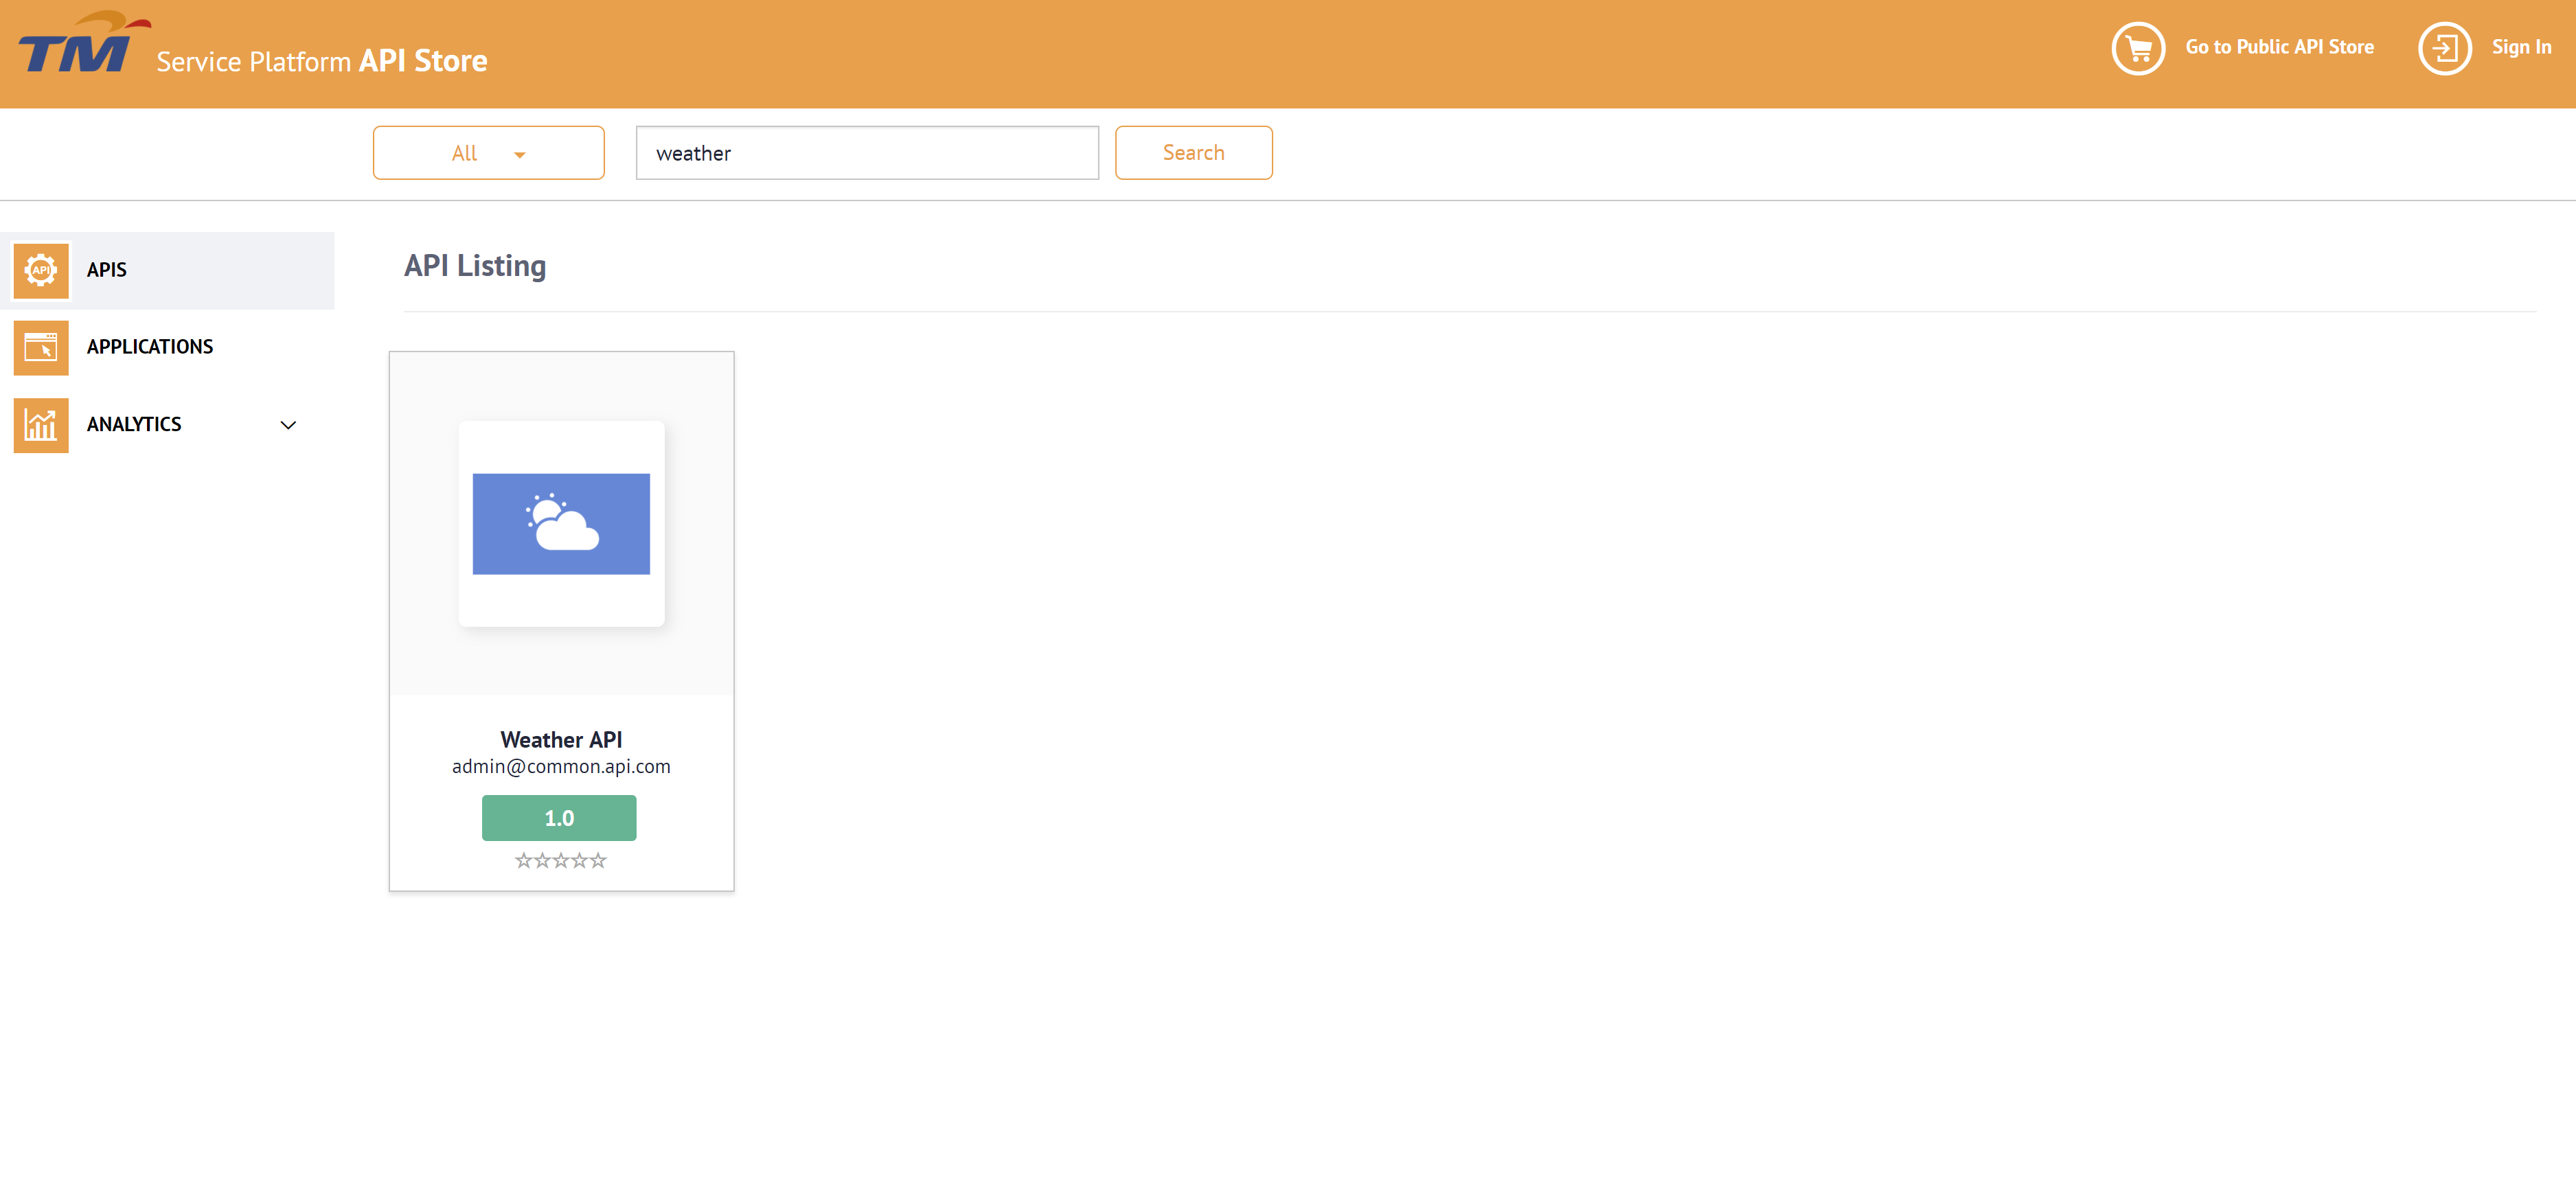
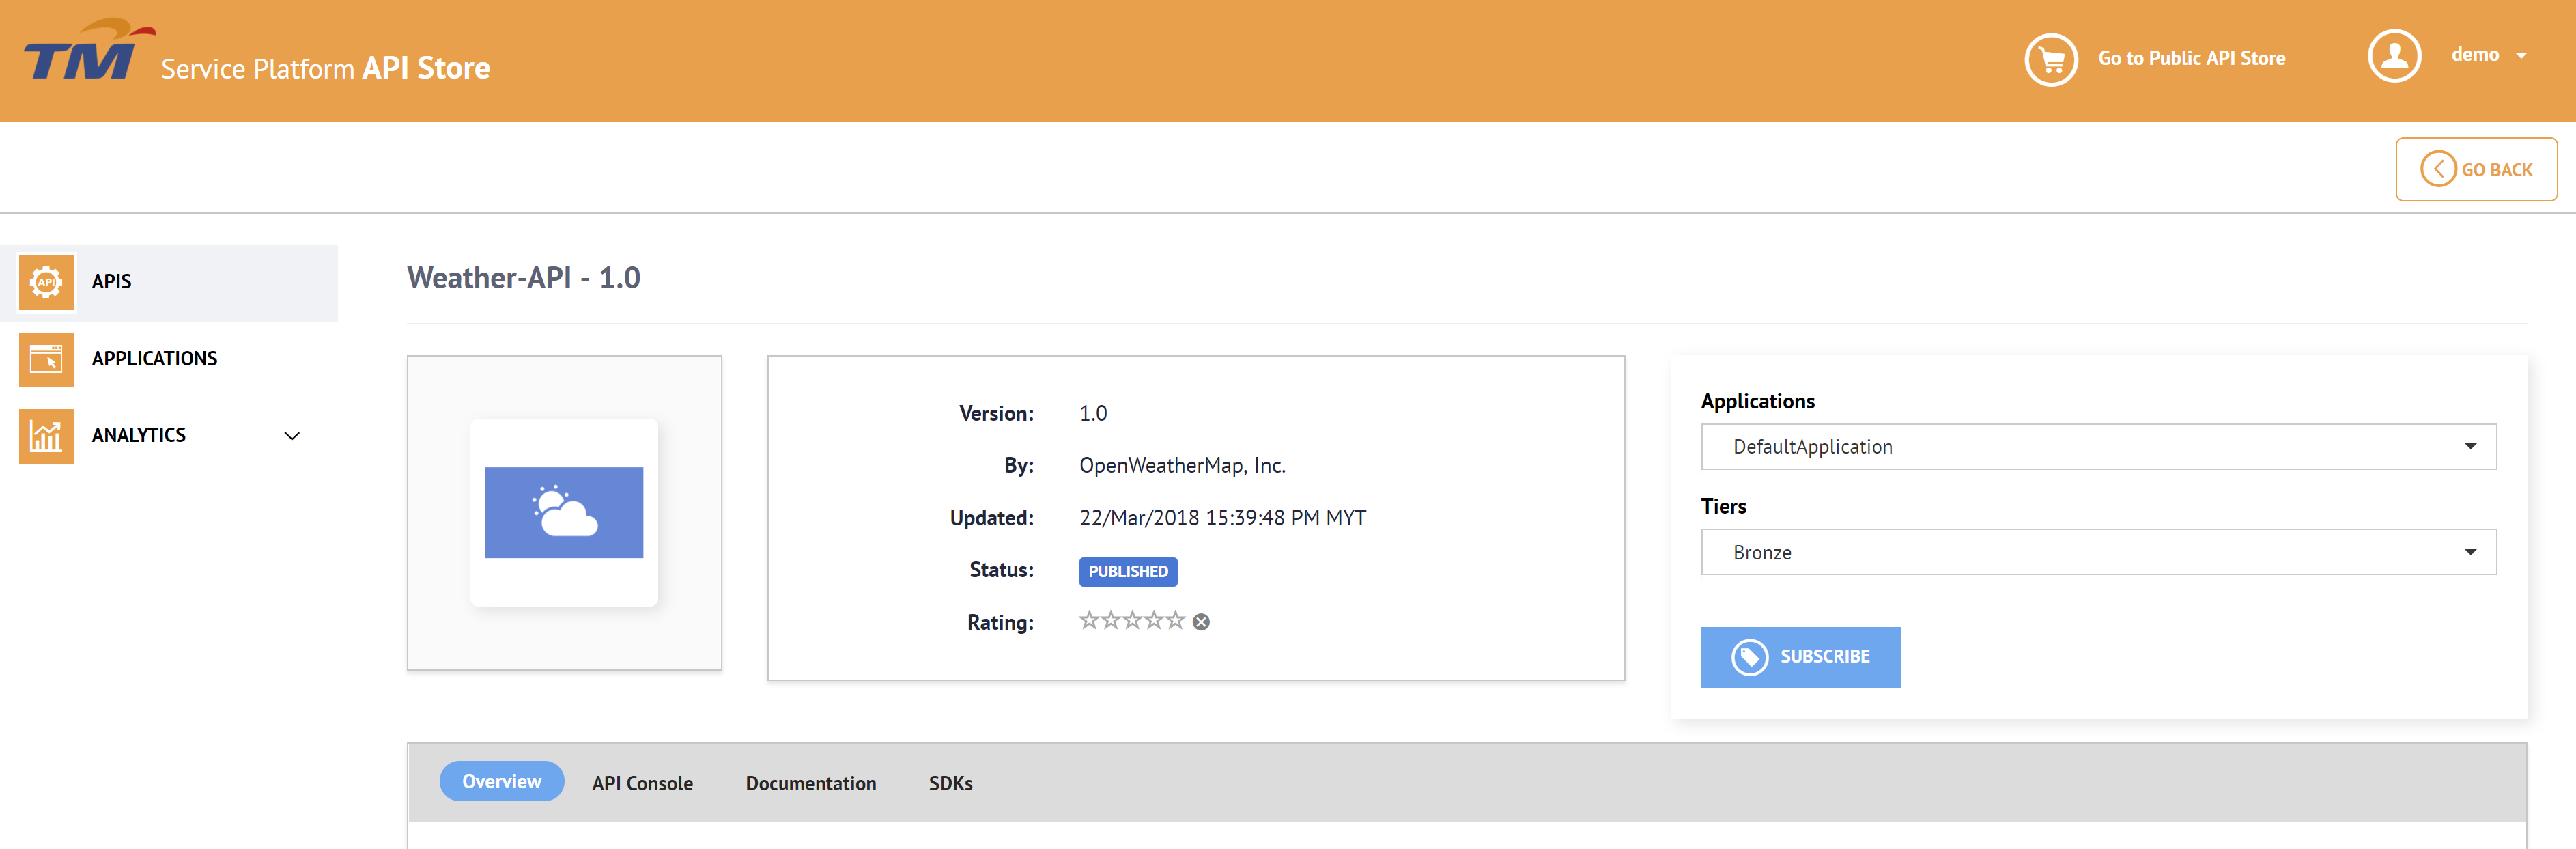
2. click on an API (e.g., Weather-API 1.0) to open it. You will see a page mentioning details of weather API as show below:
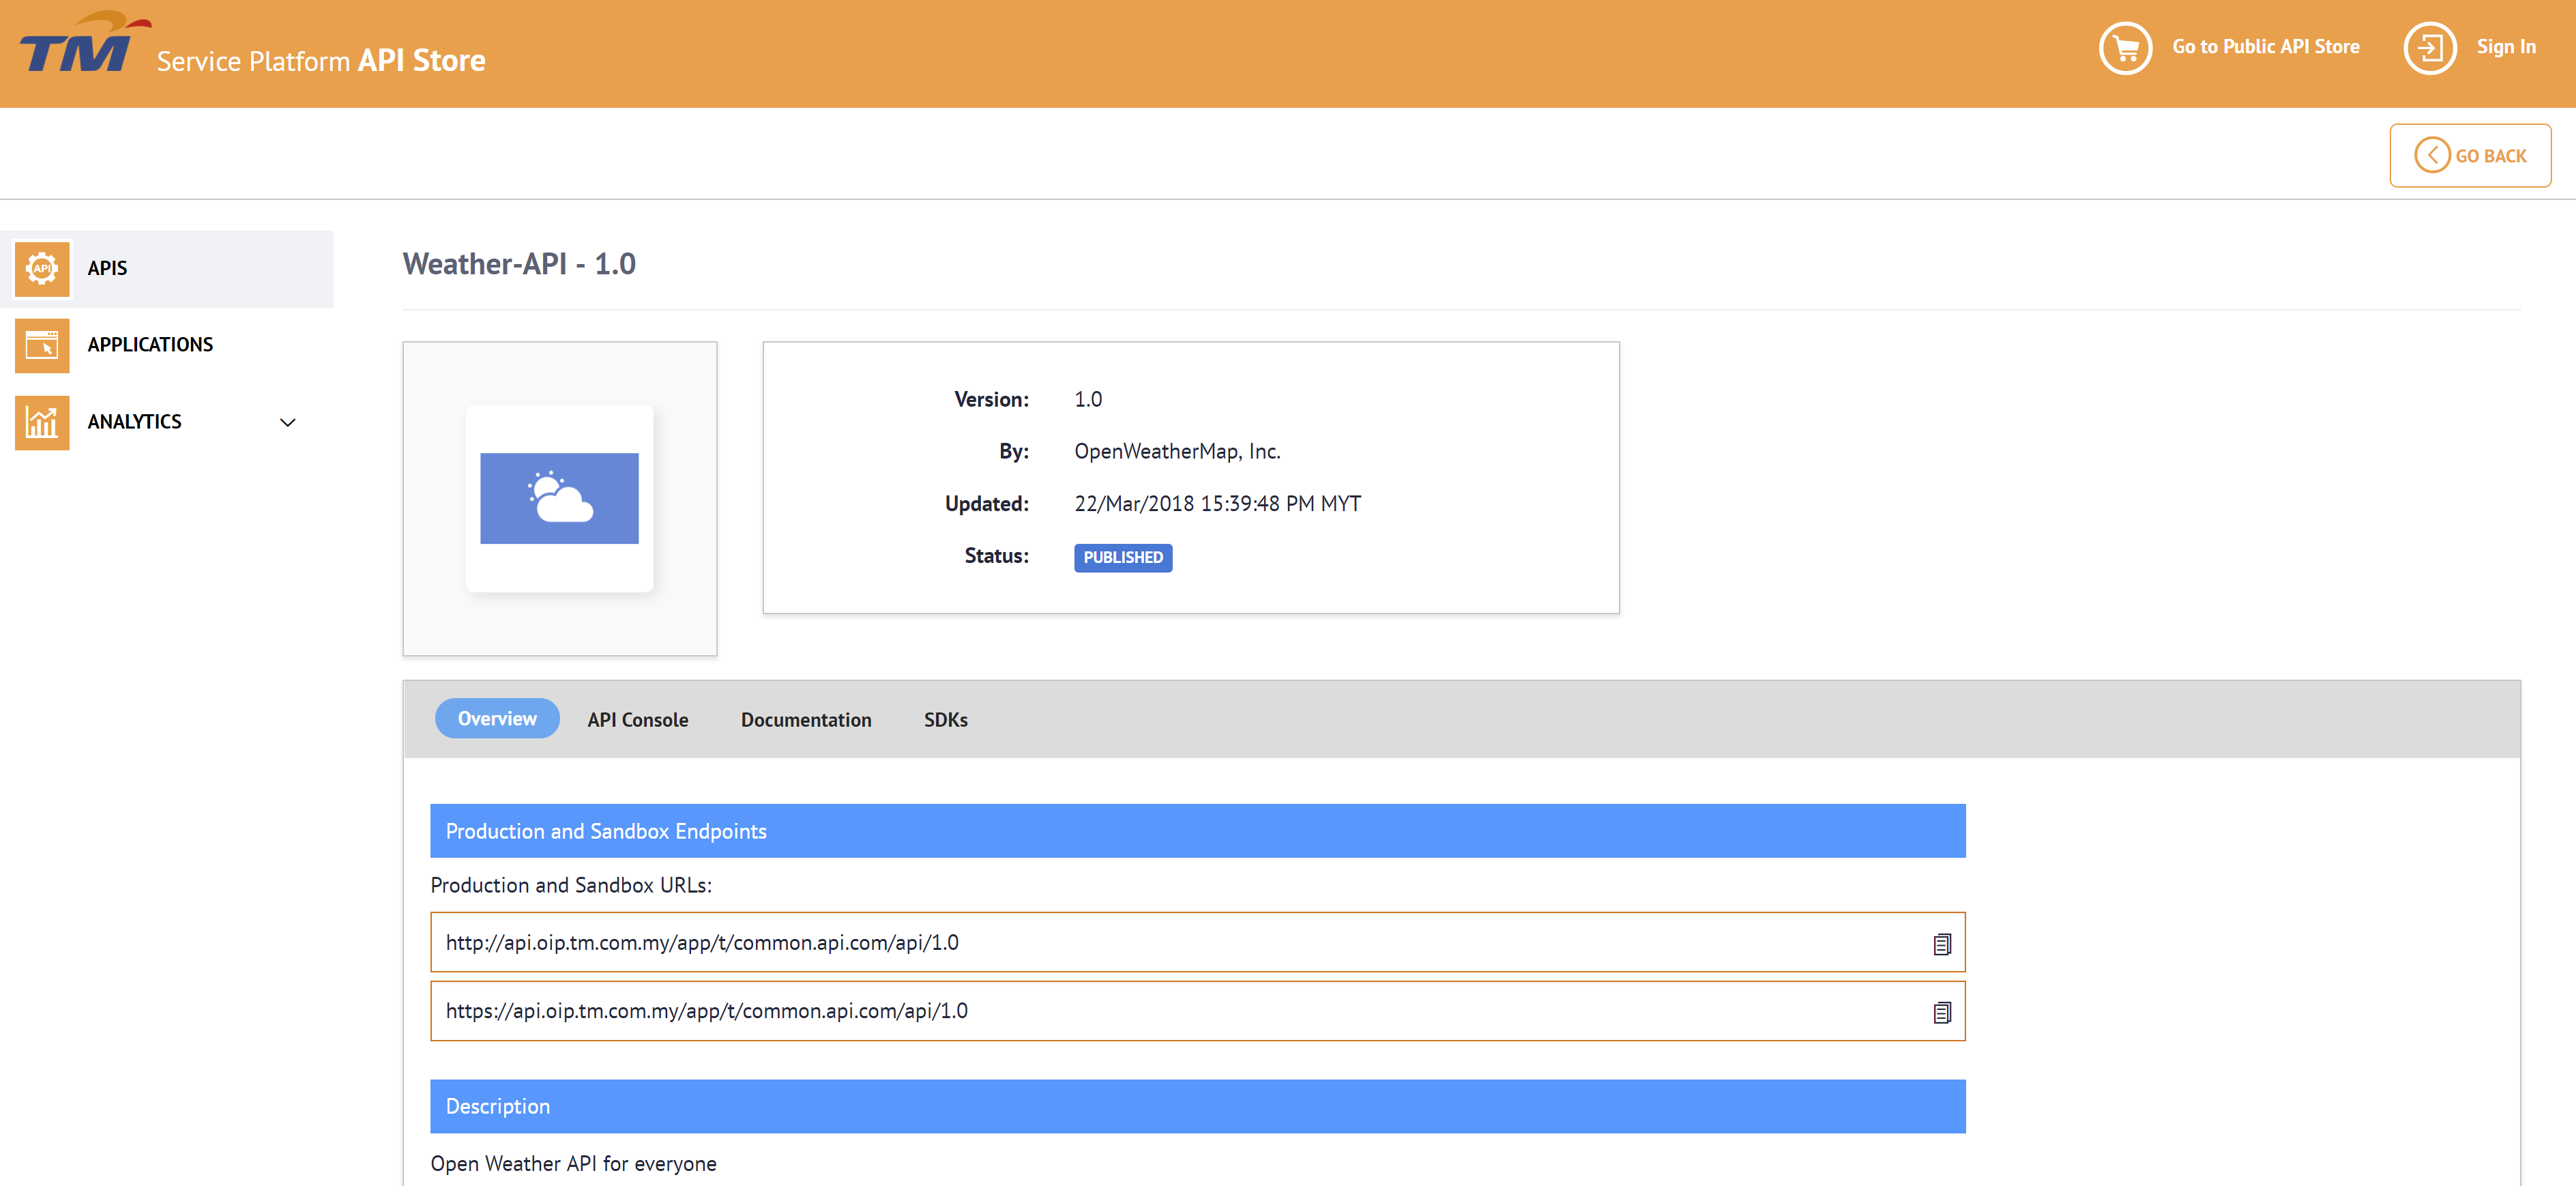
3. Note the subscription options for the REST API.

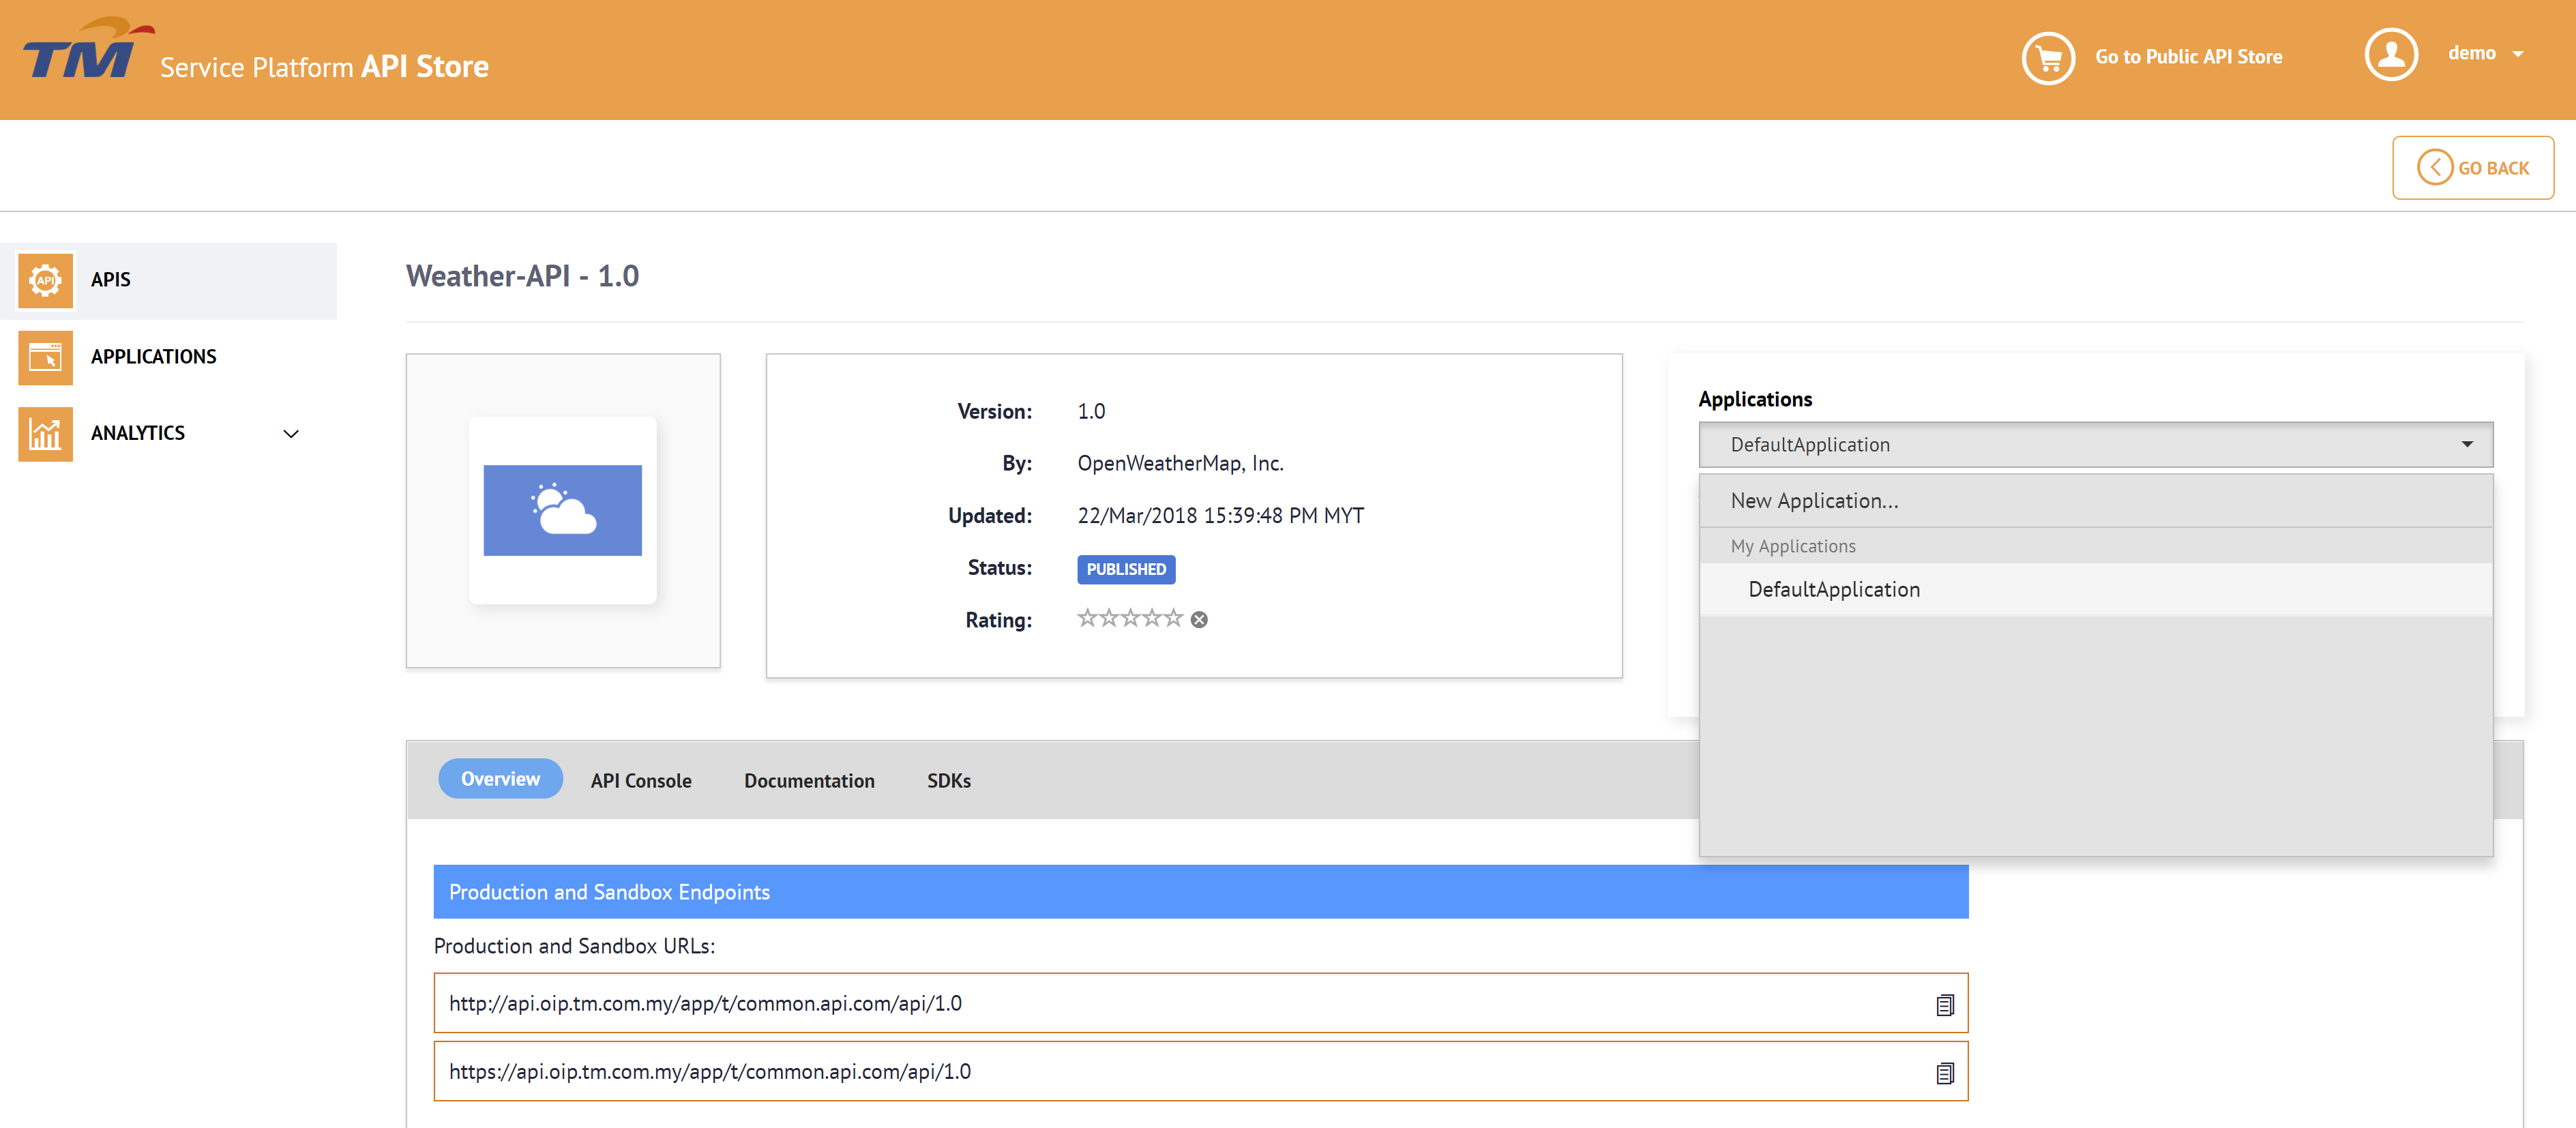
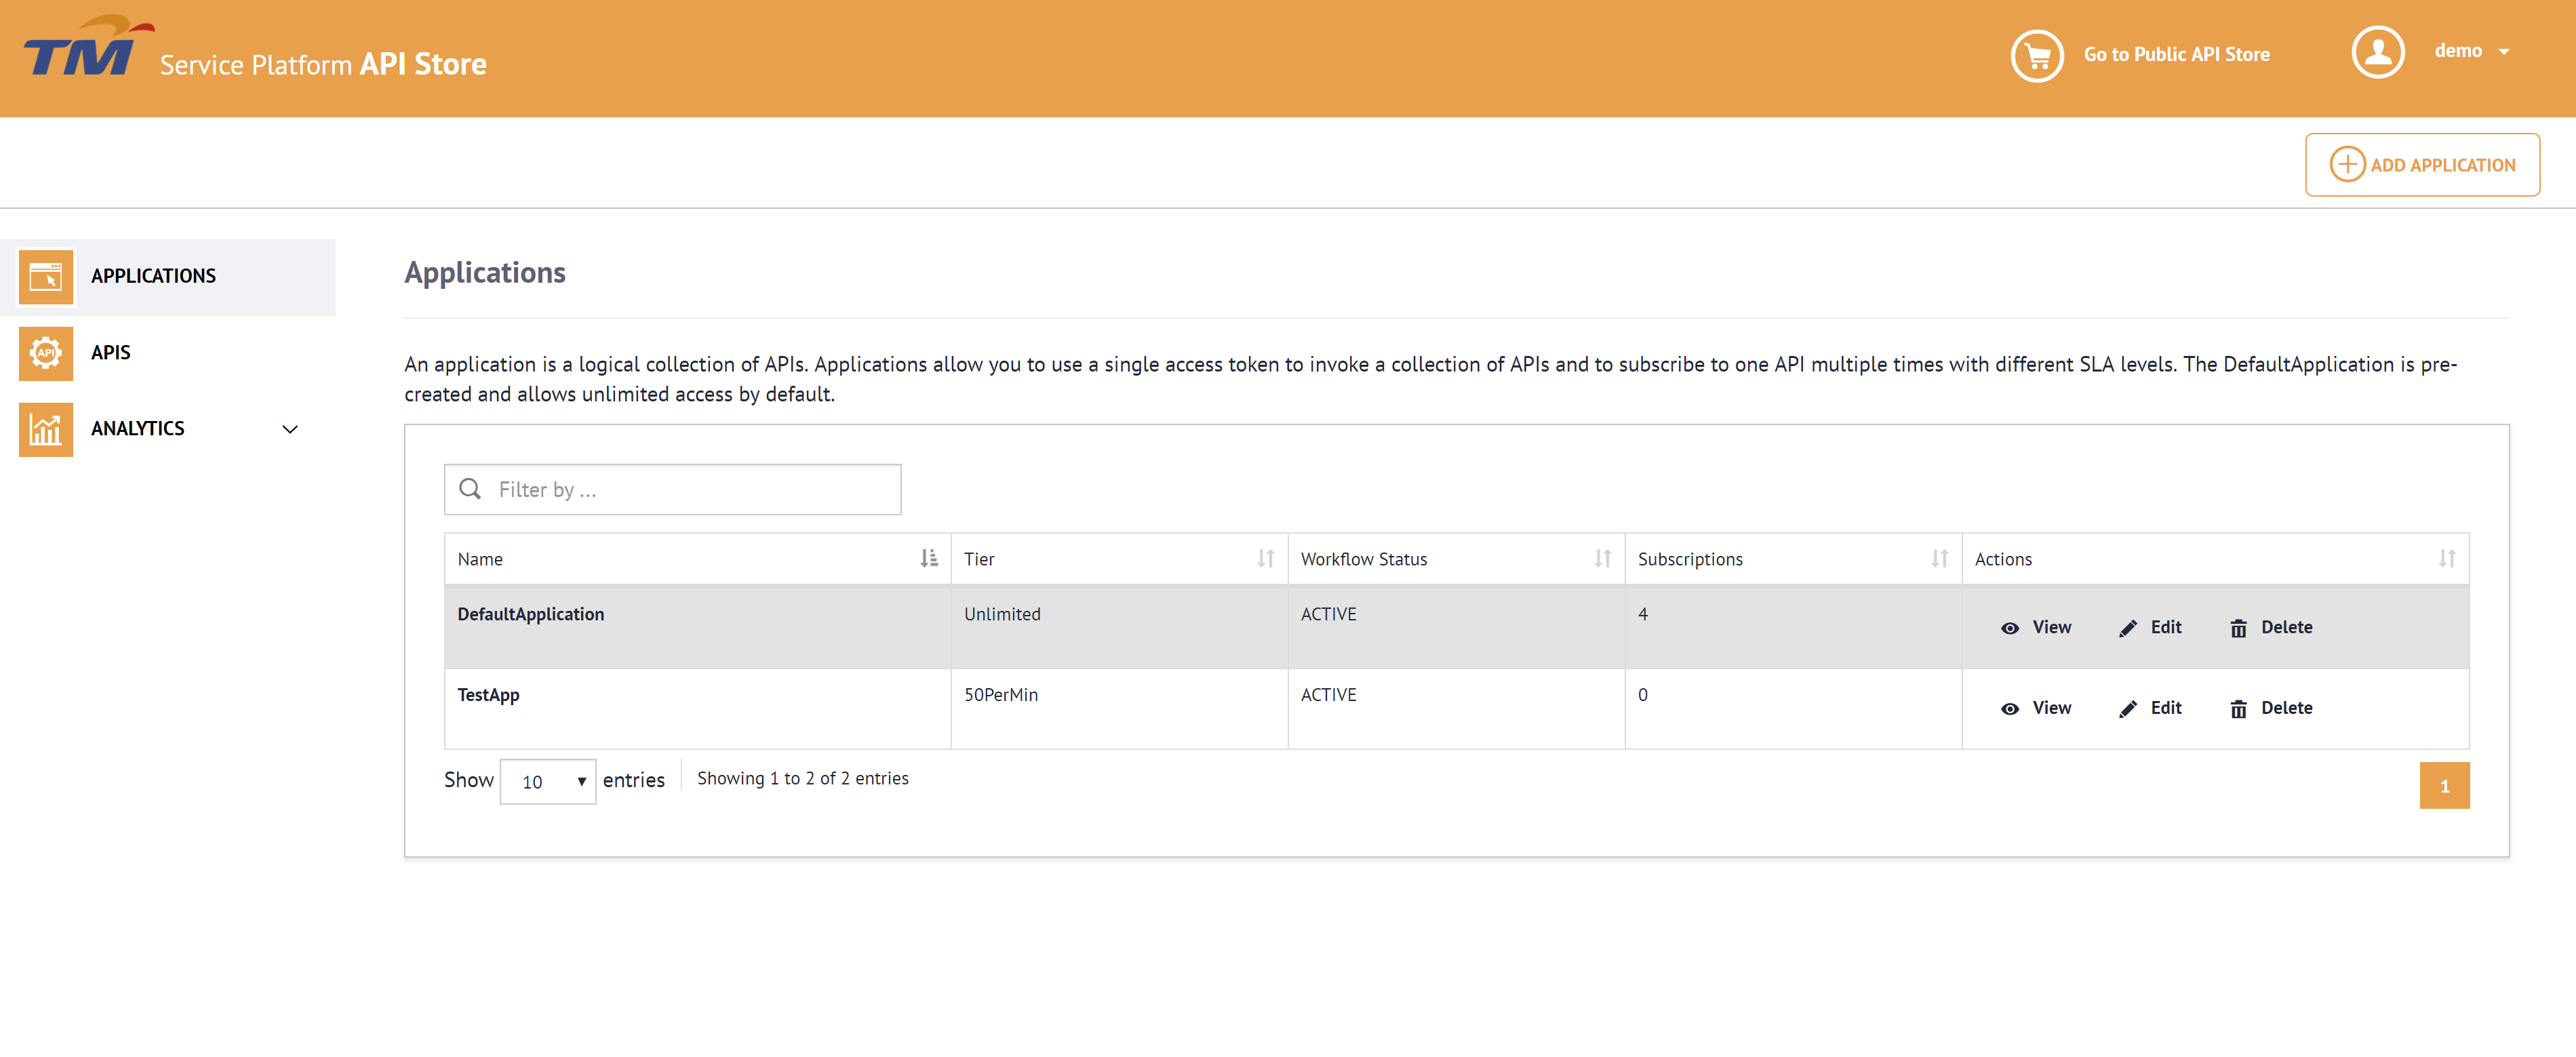
4. Click the Applications menu and click Add Application to create a new application.
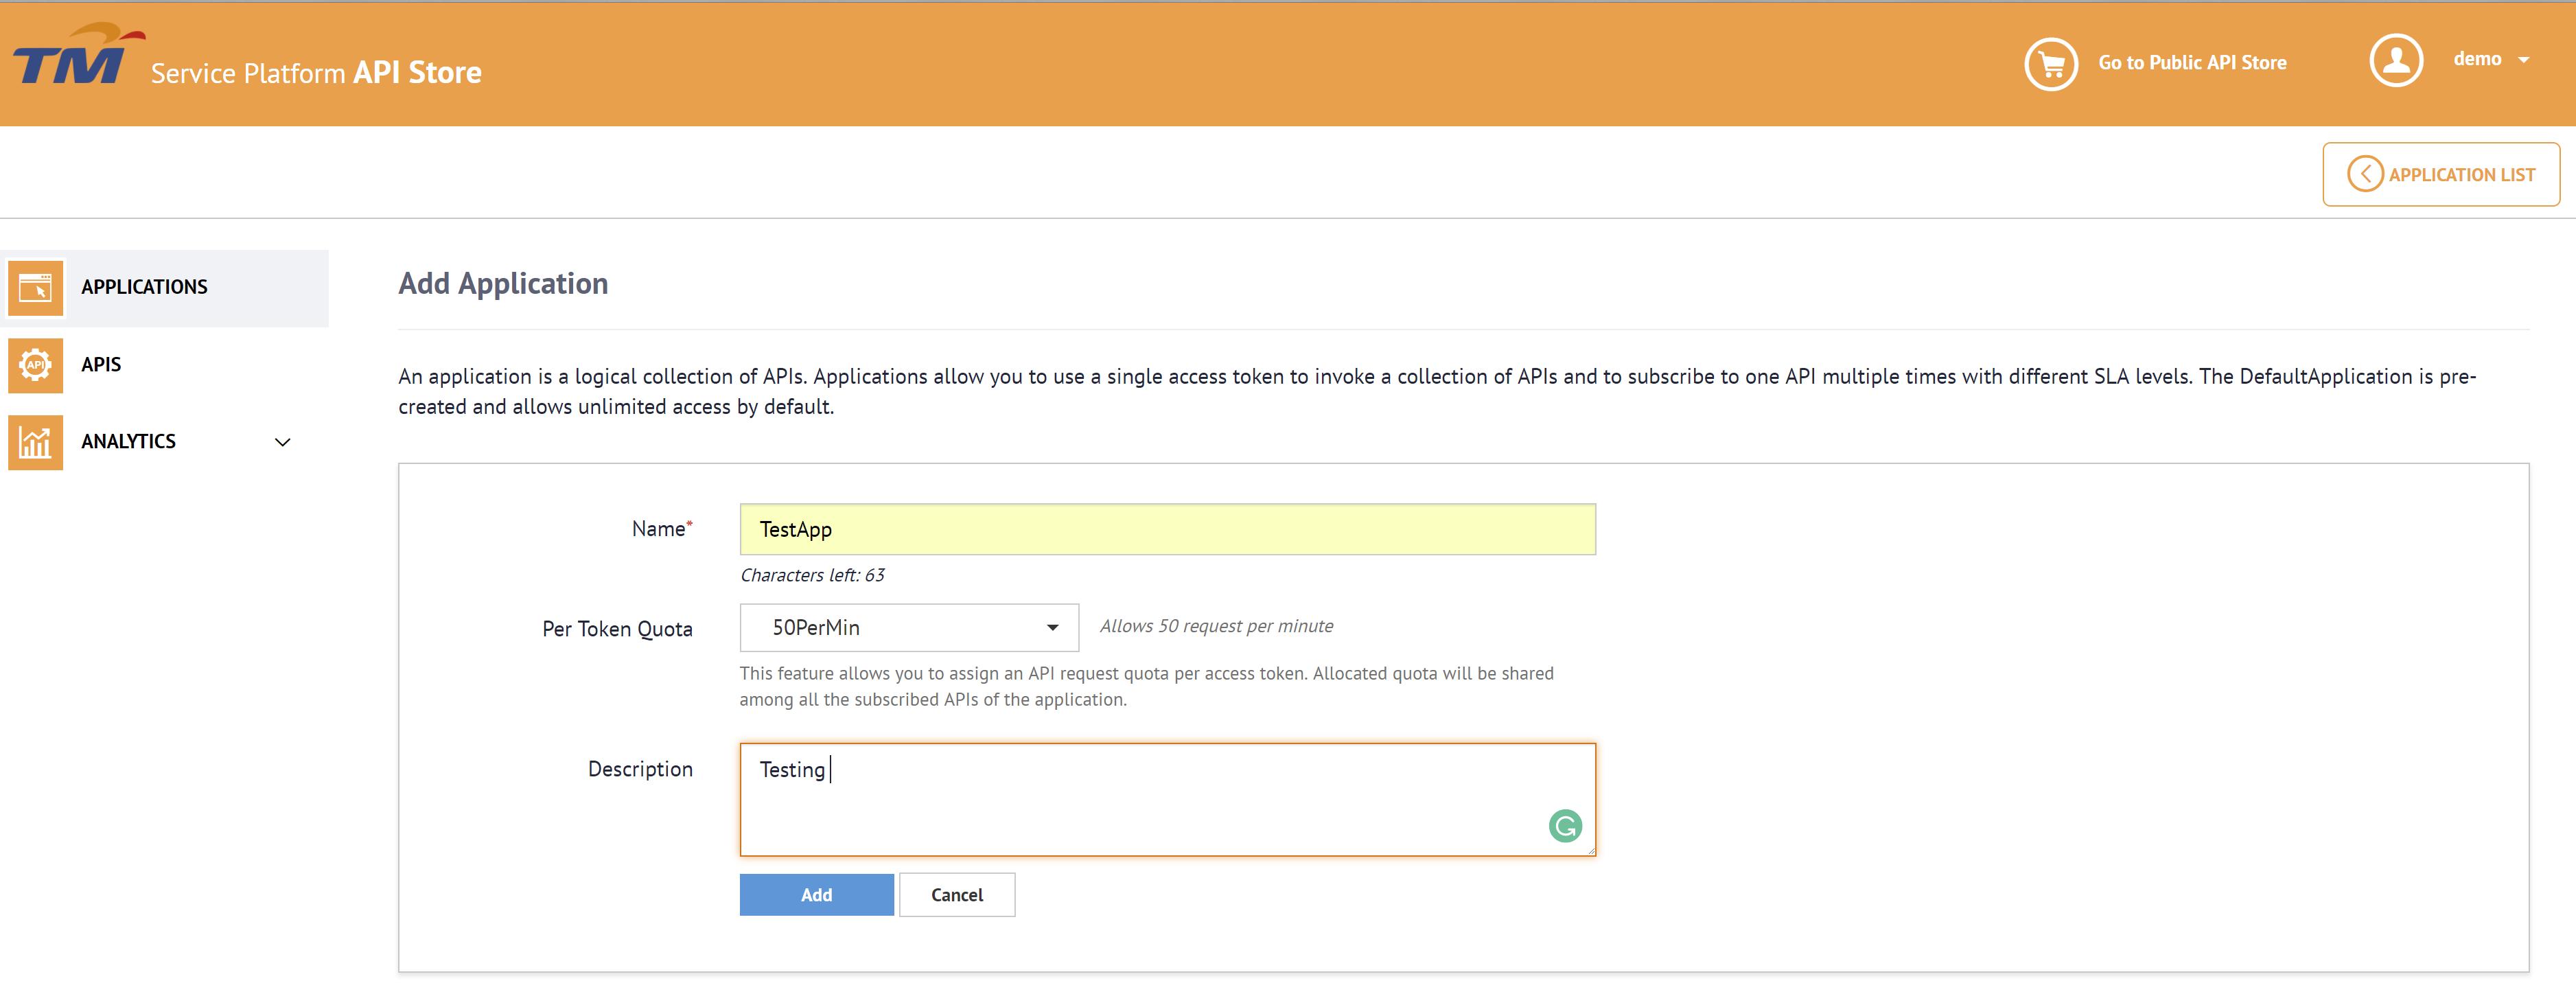
5. Enter the name as TestApp and select the per token quota as 50PerMin for the application and click Add.
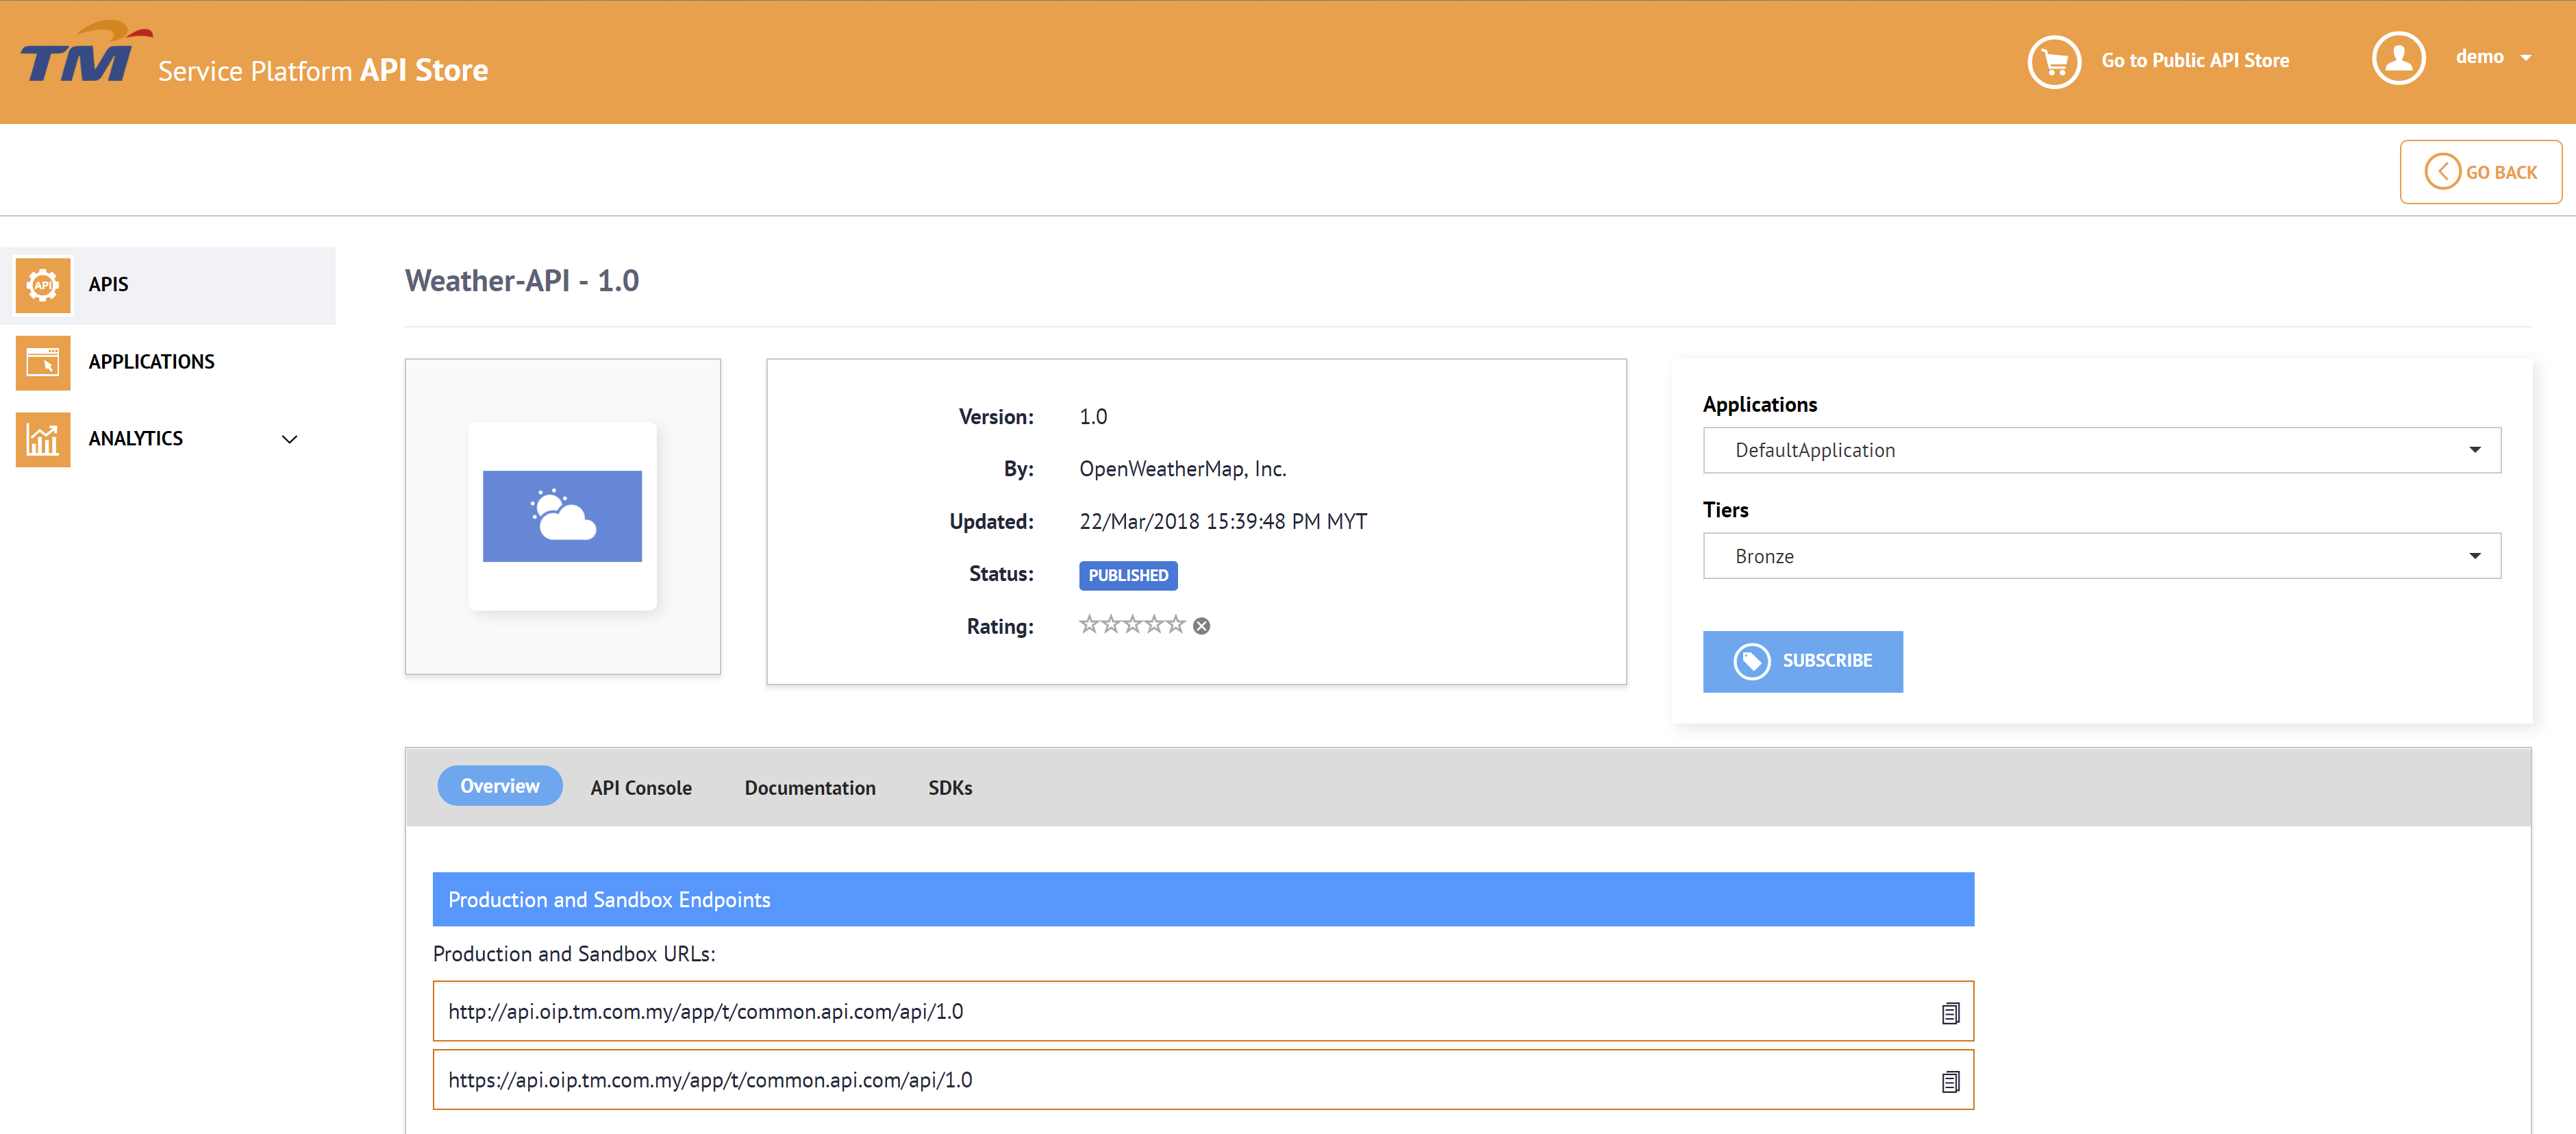
6. Click APIs and click on the Weather-API to view the API's subscription options.
7. Select the application that you just created, a tier, and click Subscribe.
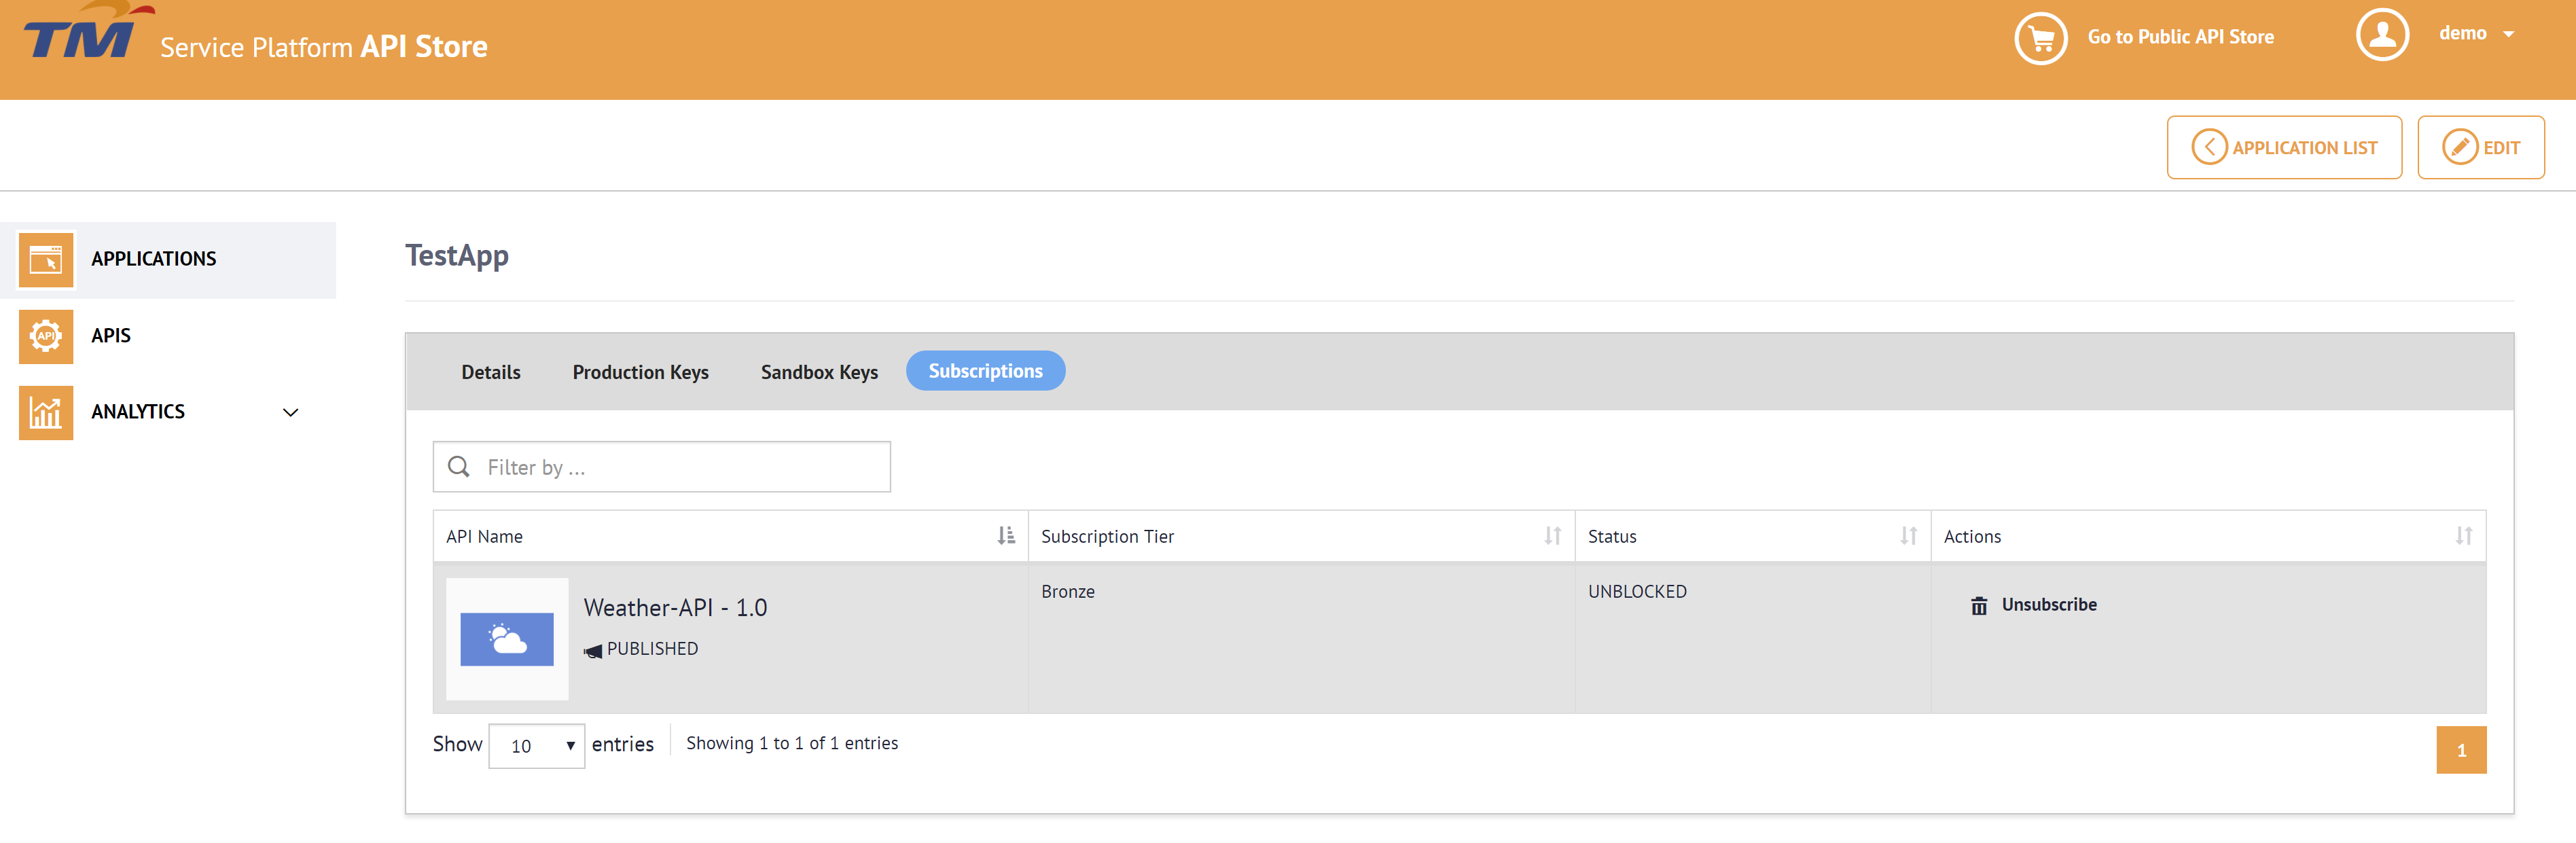
8. Click the View Subscriptions button when prompted. The Subscriptions tab will open.
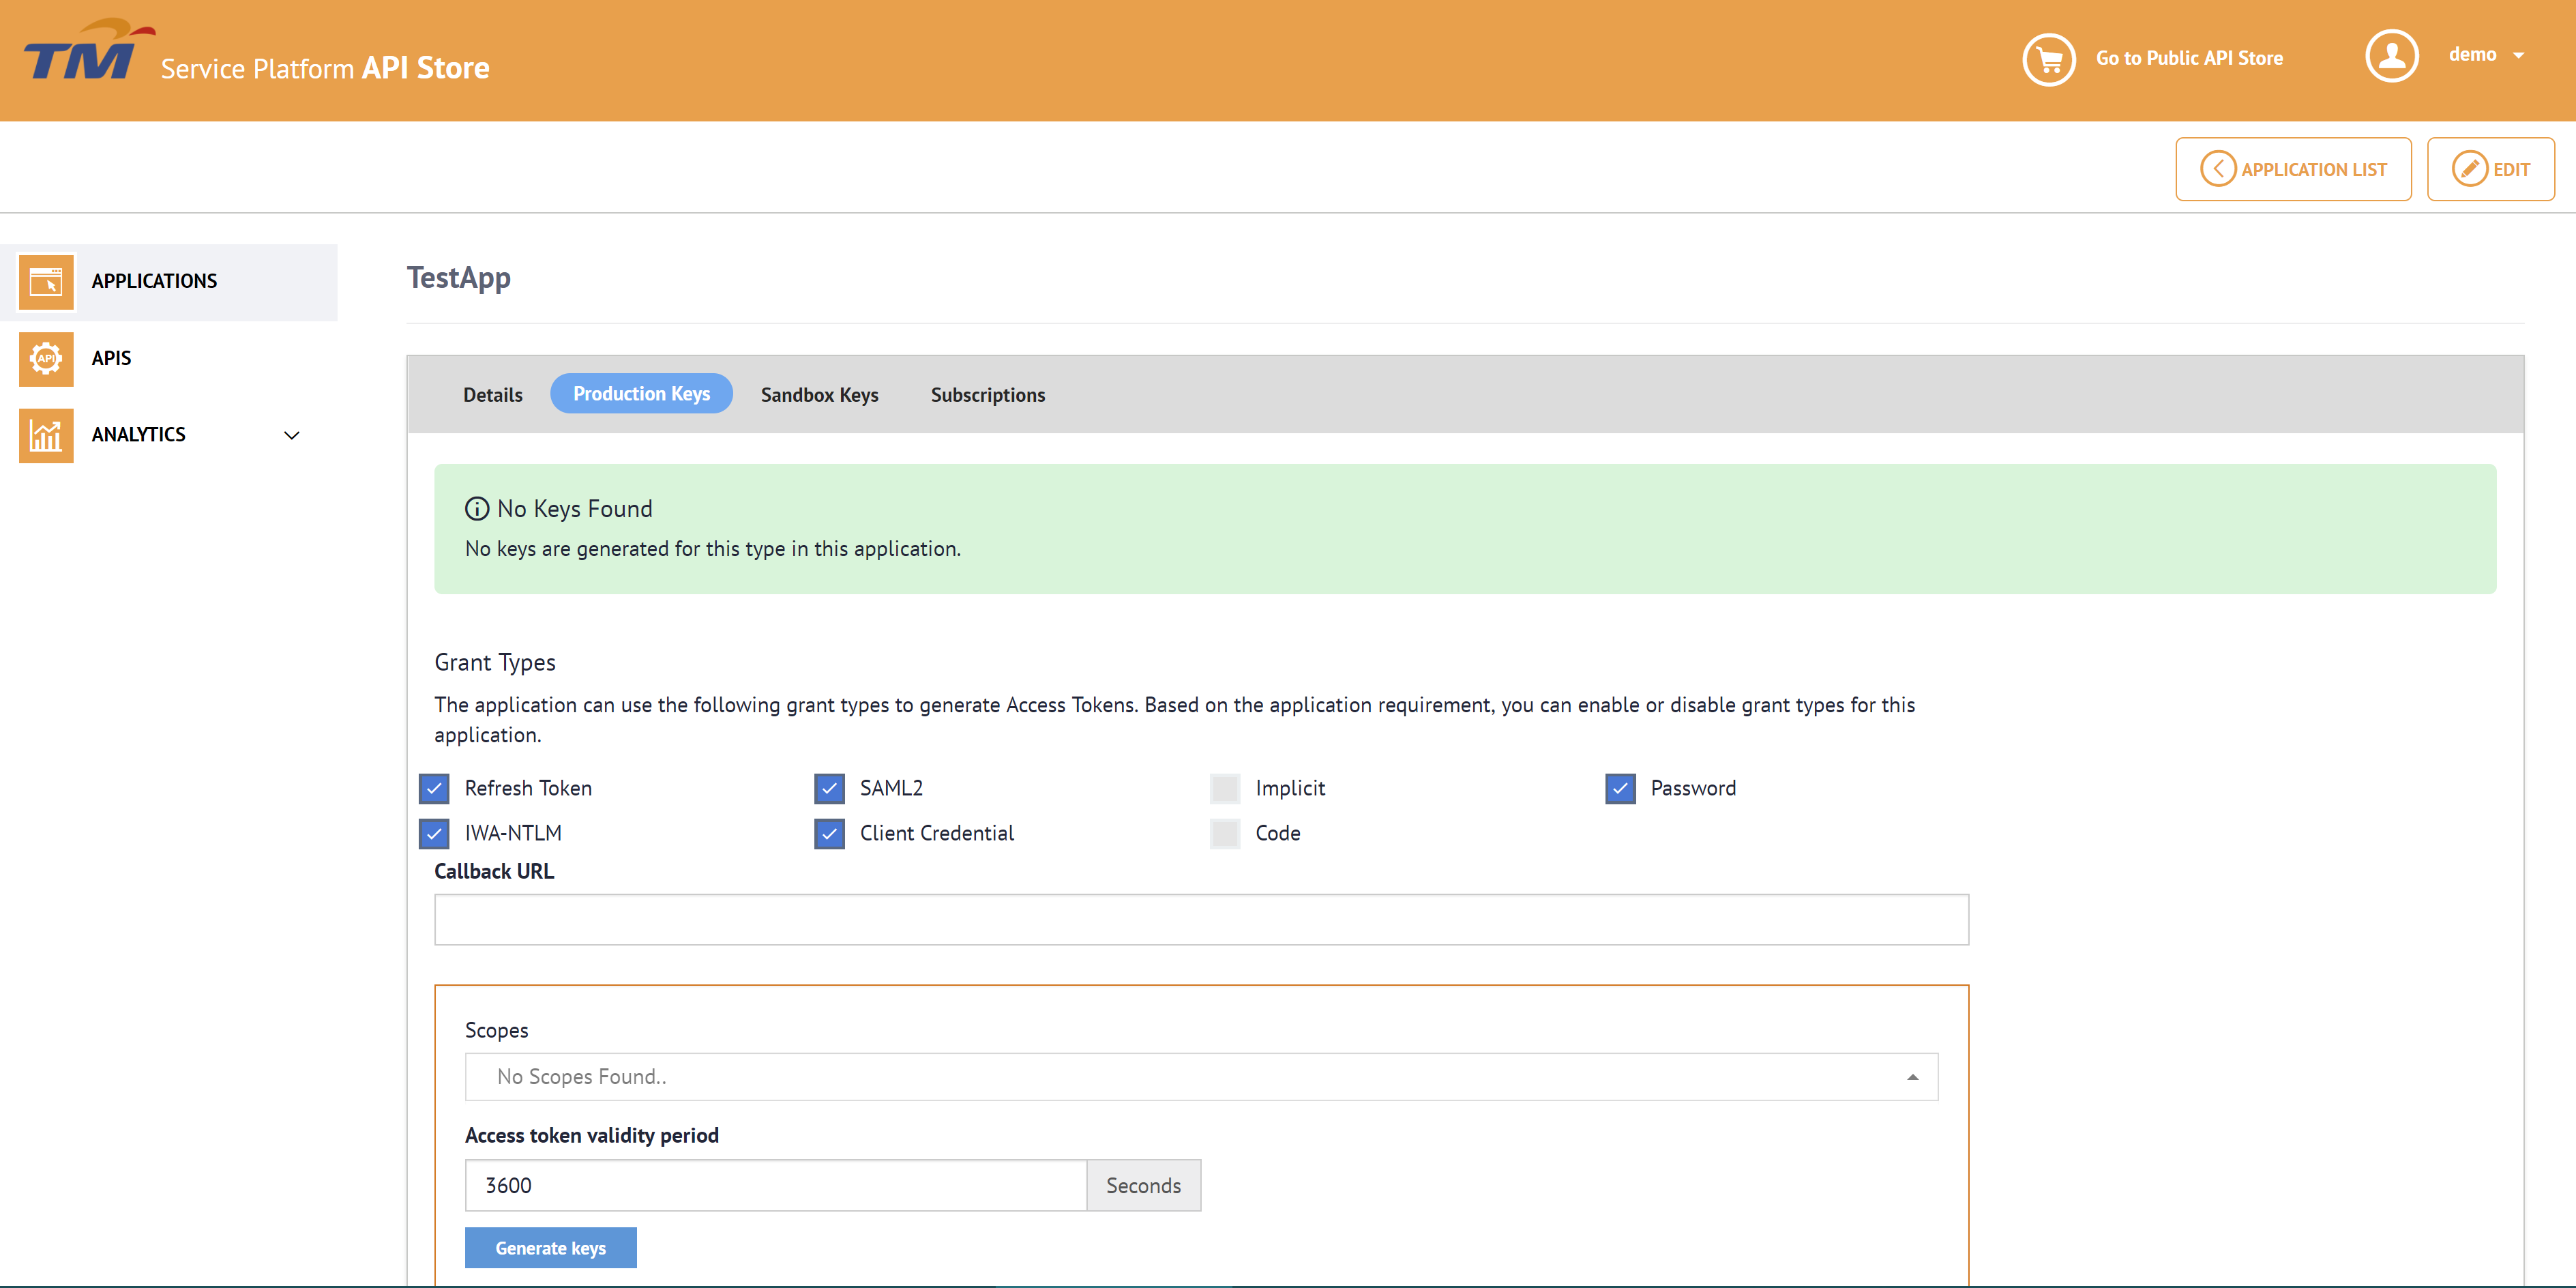
9. Click the Production Keys tab and click Generate Keys to create an application access token. You can use this token to invoke all APIs that you subscribe to using the same application.
10. Install cURL if it is not there in your environment.
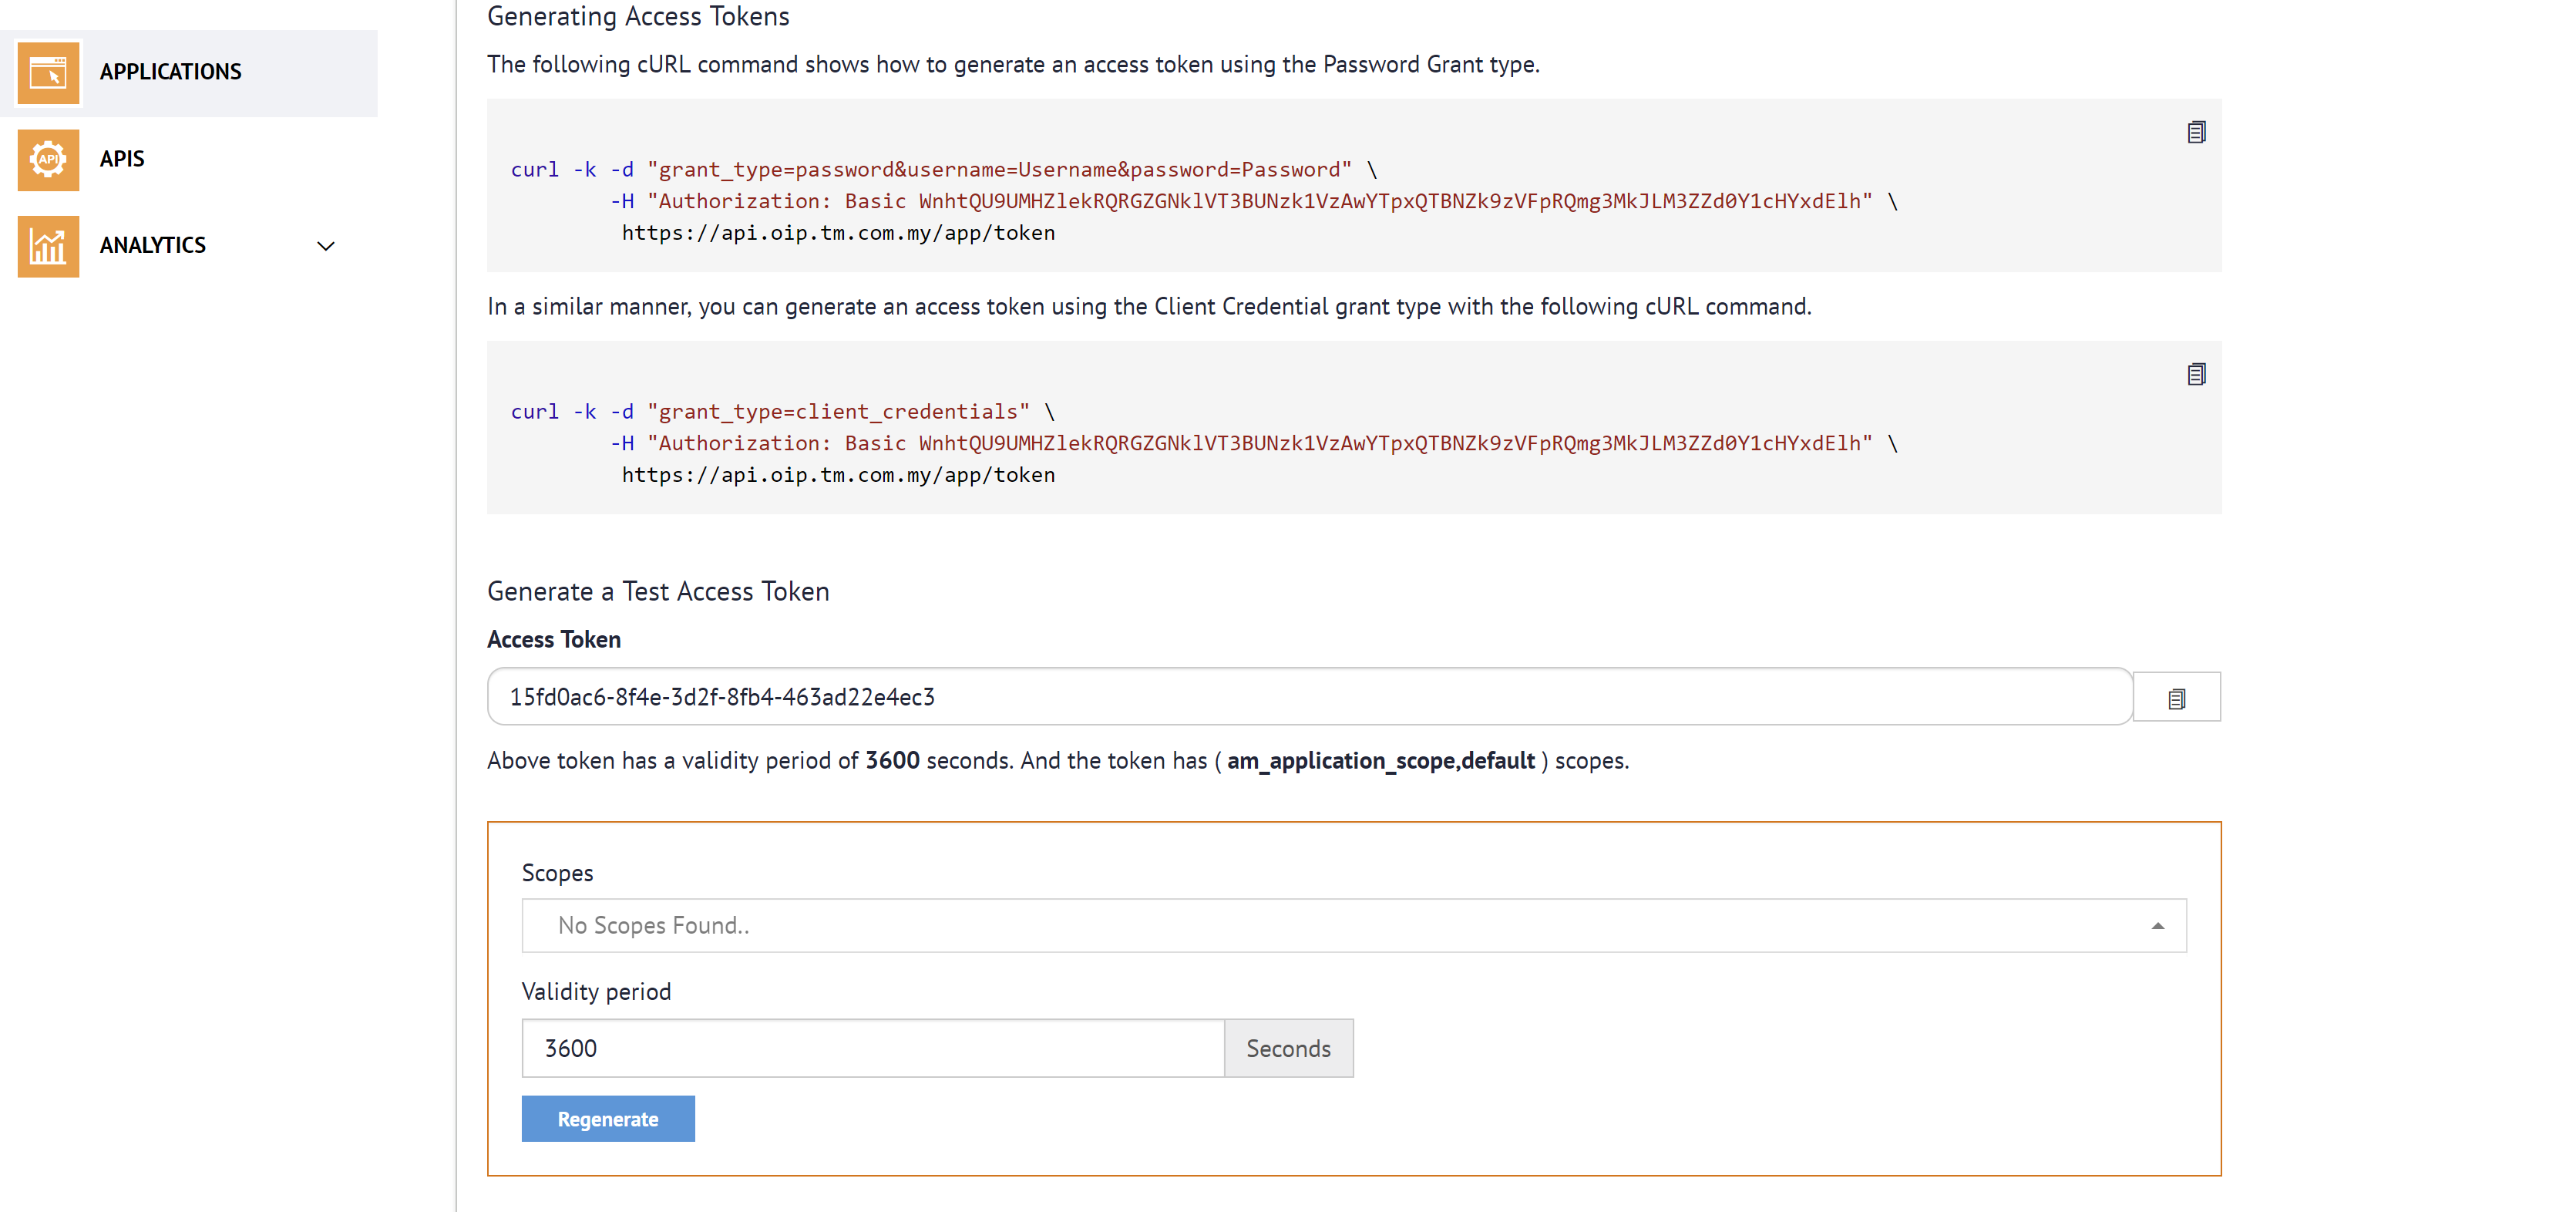
11. Open the command line and execute the cURL command on the right side of the screen:
curl -k -H "Authorization: Bearer <access_token>" -v '<api_url><payload>'Be sure to replace the placeholders as follows:
- access token: Give the test token generated in step 9. Click Applications, click on the respective application, which in this case is TestApp, click Production Key, and click on show keys.
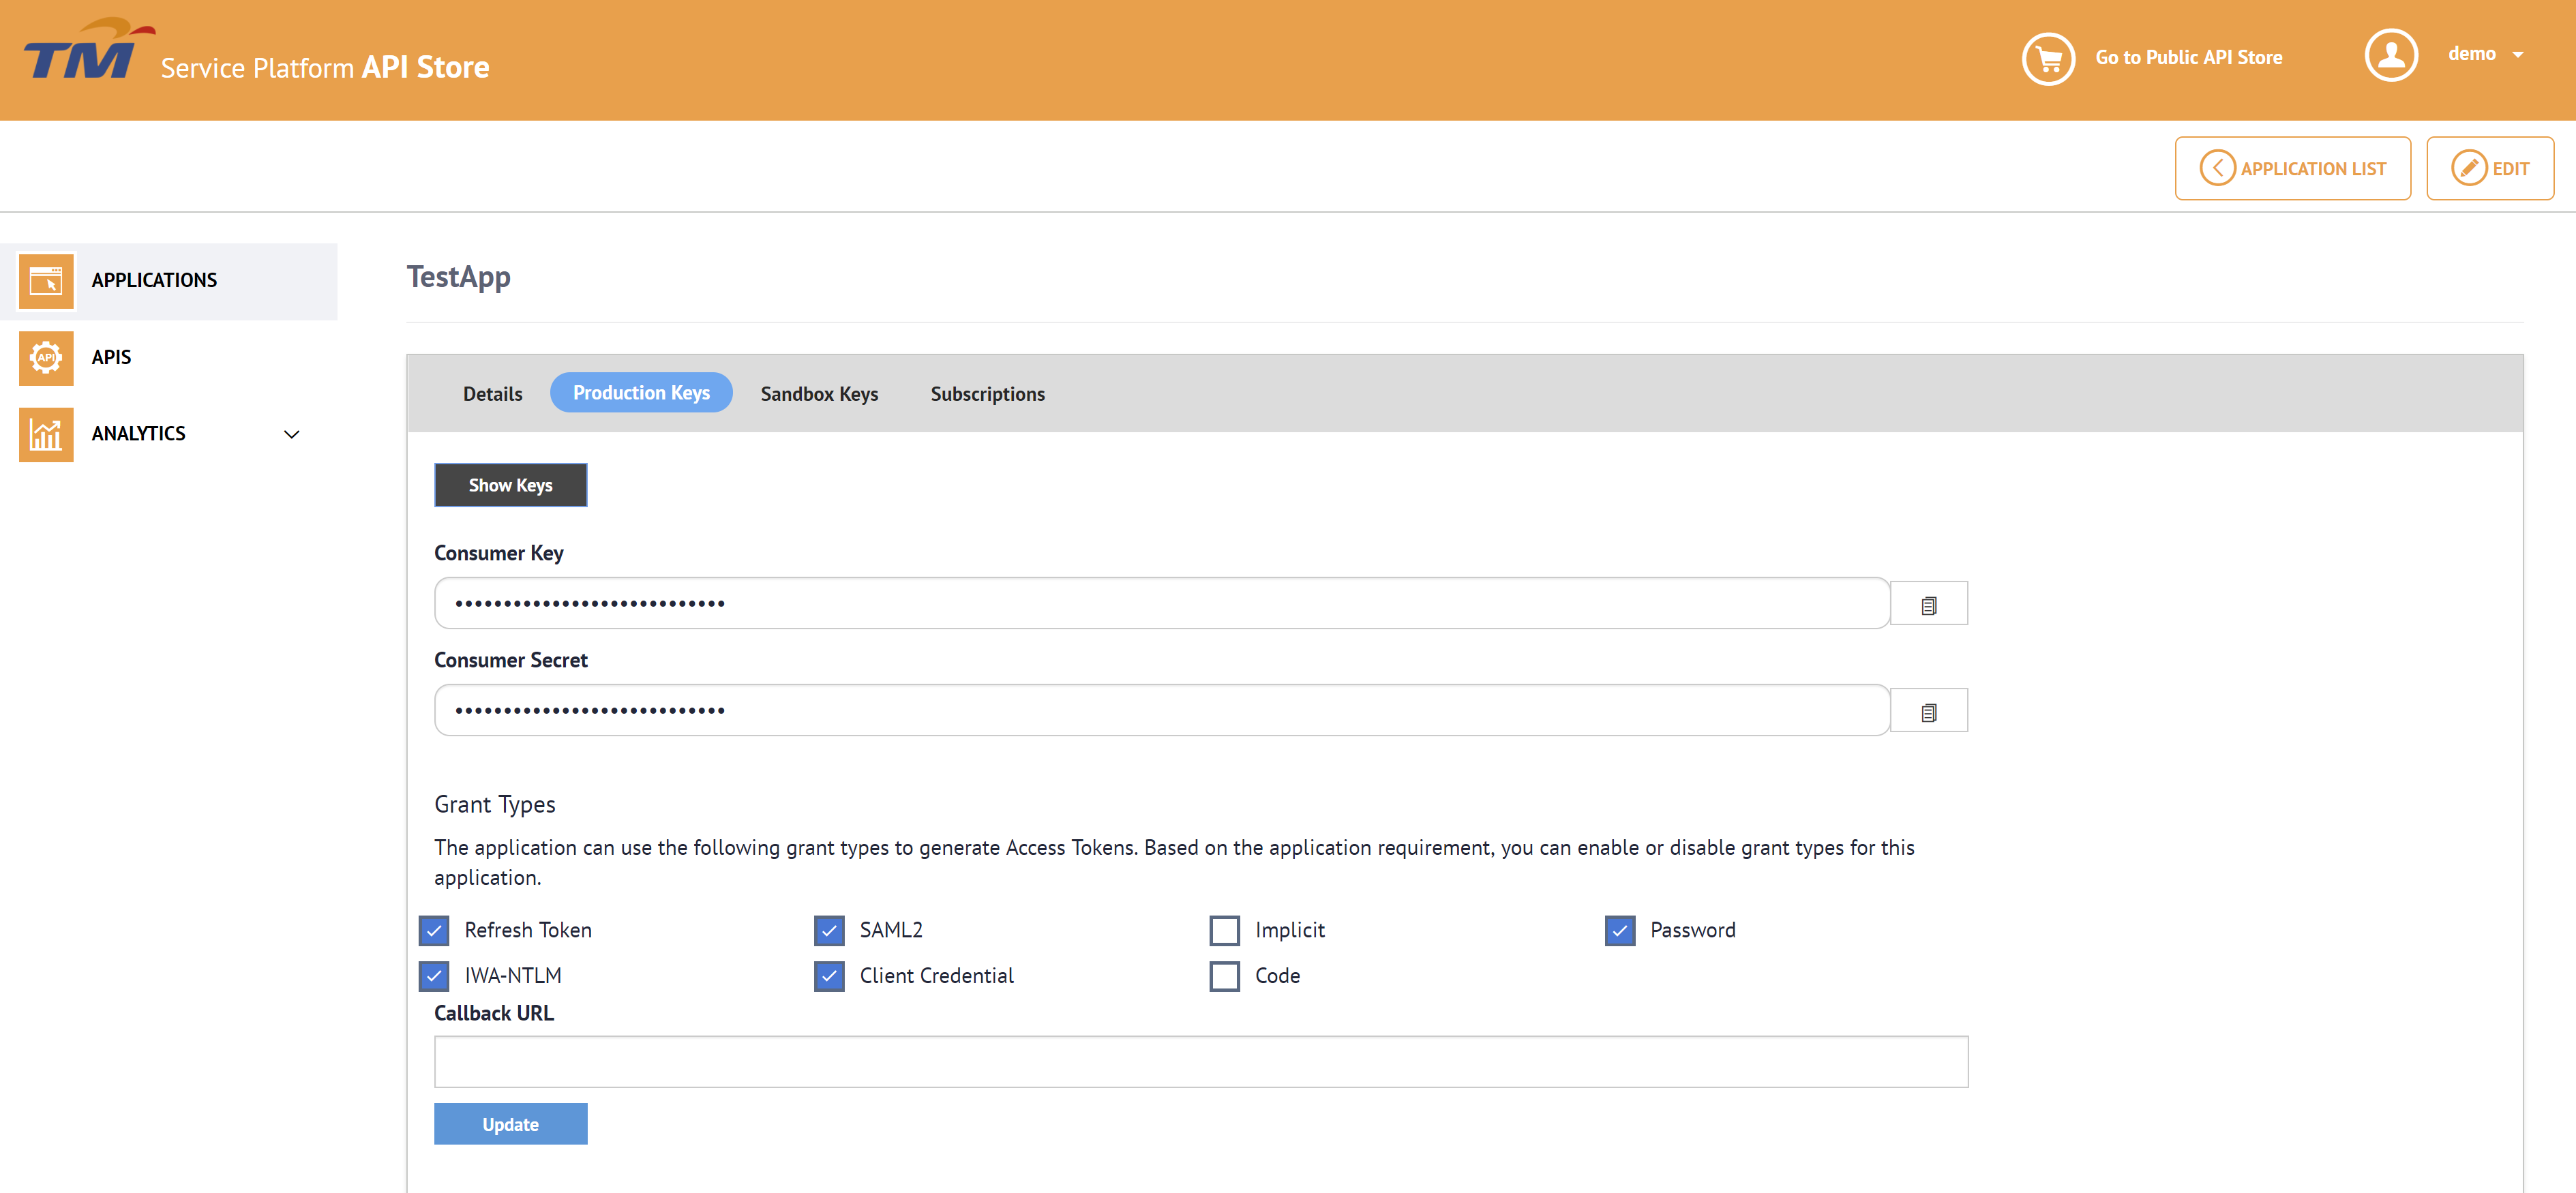
Then copy the Access token
- api_url: Click on the respective API, which in this case is "Weather-API". When the API's Overview tab appears in the API Store copy the production URL and append the payload to it.
For example,
https://api.oip.tm.com.my/info/1.0/data/2.5/weather?q=london&appid=b6907d289e10d714a6e88b30761fae22
Troubleshooting
If you get an error that states "Invalid Credentials", carryout the following steps to overcome the error.
- Optionally, you can update the token validity period in the Access token validity period text box so that the access token will be valid for a longer period, or you can even set a minus value (e.g., -1) so that the token never expires.
- Re-generate the access token. Click Applications, click on the respective application (i.e., TestApp), click Production Key, and click Re-generate. Thereafter, use the new access token when running the cURL commands.
You have subscribed to an API and invoked it. To unsubscribe from an API, click the Applications menu and click View next to the application used for the subscription. Go to the Subscriptions tab, locate the API, and click the Unsubscribe link associated with it.
Using an API from integrated API console
Swagger is a 100% open source, standard, language-agnostic specification and a complete framework for describing, producing, consuming, and visualizing RESTful APIs, without the need of a proxy or third-party services. Swagger allows consumers to understand the capabilities of a remote service without accessing its source code and interacts with the service with a minimal amount of implementation logic. Swagger helps describe a service in the same way that interfaces describe lower-level programming code.
The Swagger UI is a dependency-free collection of HTML, JavaScript, and CSS that dynamically generate documentation from a Swagger-compliant API. Swagger-compliant APIs give you interactive documentation, client SDK generation and more discoverability. The Swagger UI has JSON code and its UI facilitates easier code indentation, keyword highlighting, and shows syntax errors on the fly. You can add resource parameters, summaries, and descriptions to your APIs using the Swagger UI.
The examples here use the Weather-API REST API, which is created in the section Create and Publish an API.
1. Sign in to the TM API Store and click an API (e.g., Weather-API). https://store.oip.tm.com.my/apimanager/store/apis/
2. Subscribe to the API (e.g., Weather-API) using the default application and an available tier.
3. Click on the Applications menu and open the default application which you used to subscribe to the API. Click the Production Keys tab and click Generate keys to generate a production key.
4. Click on the APIs menu and then click on the API that you want to invoke. When the API opens, go to its API Console tab.
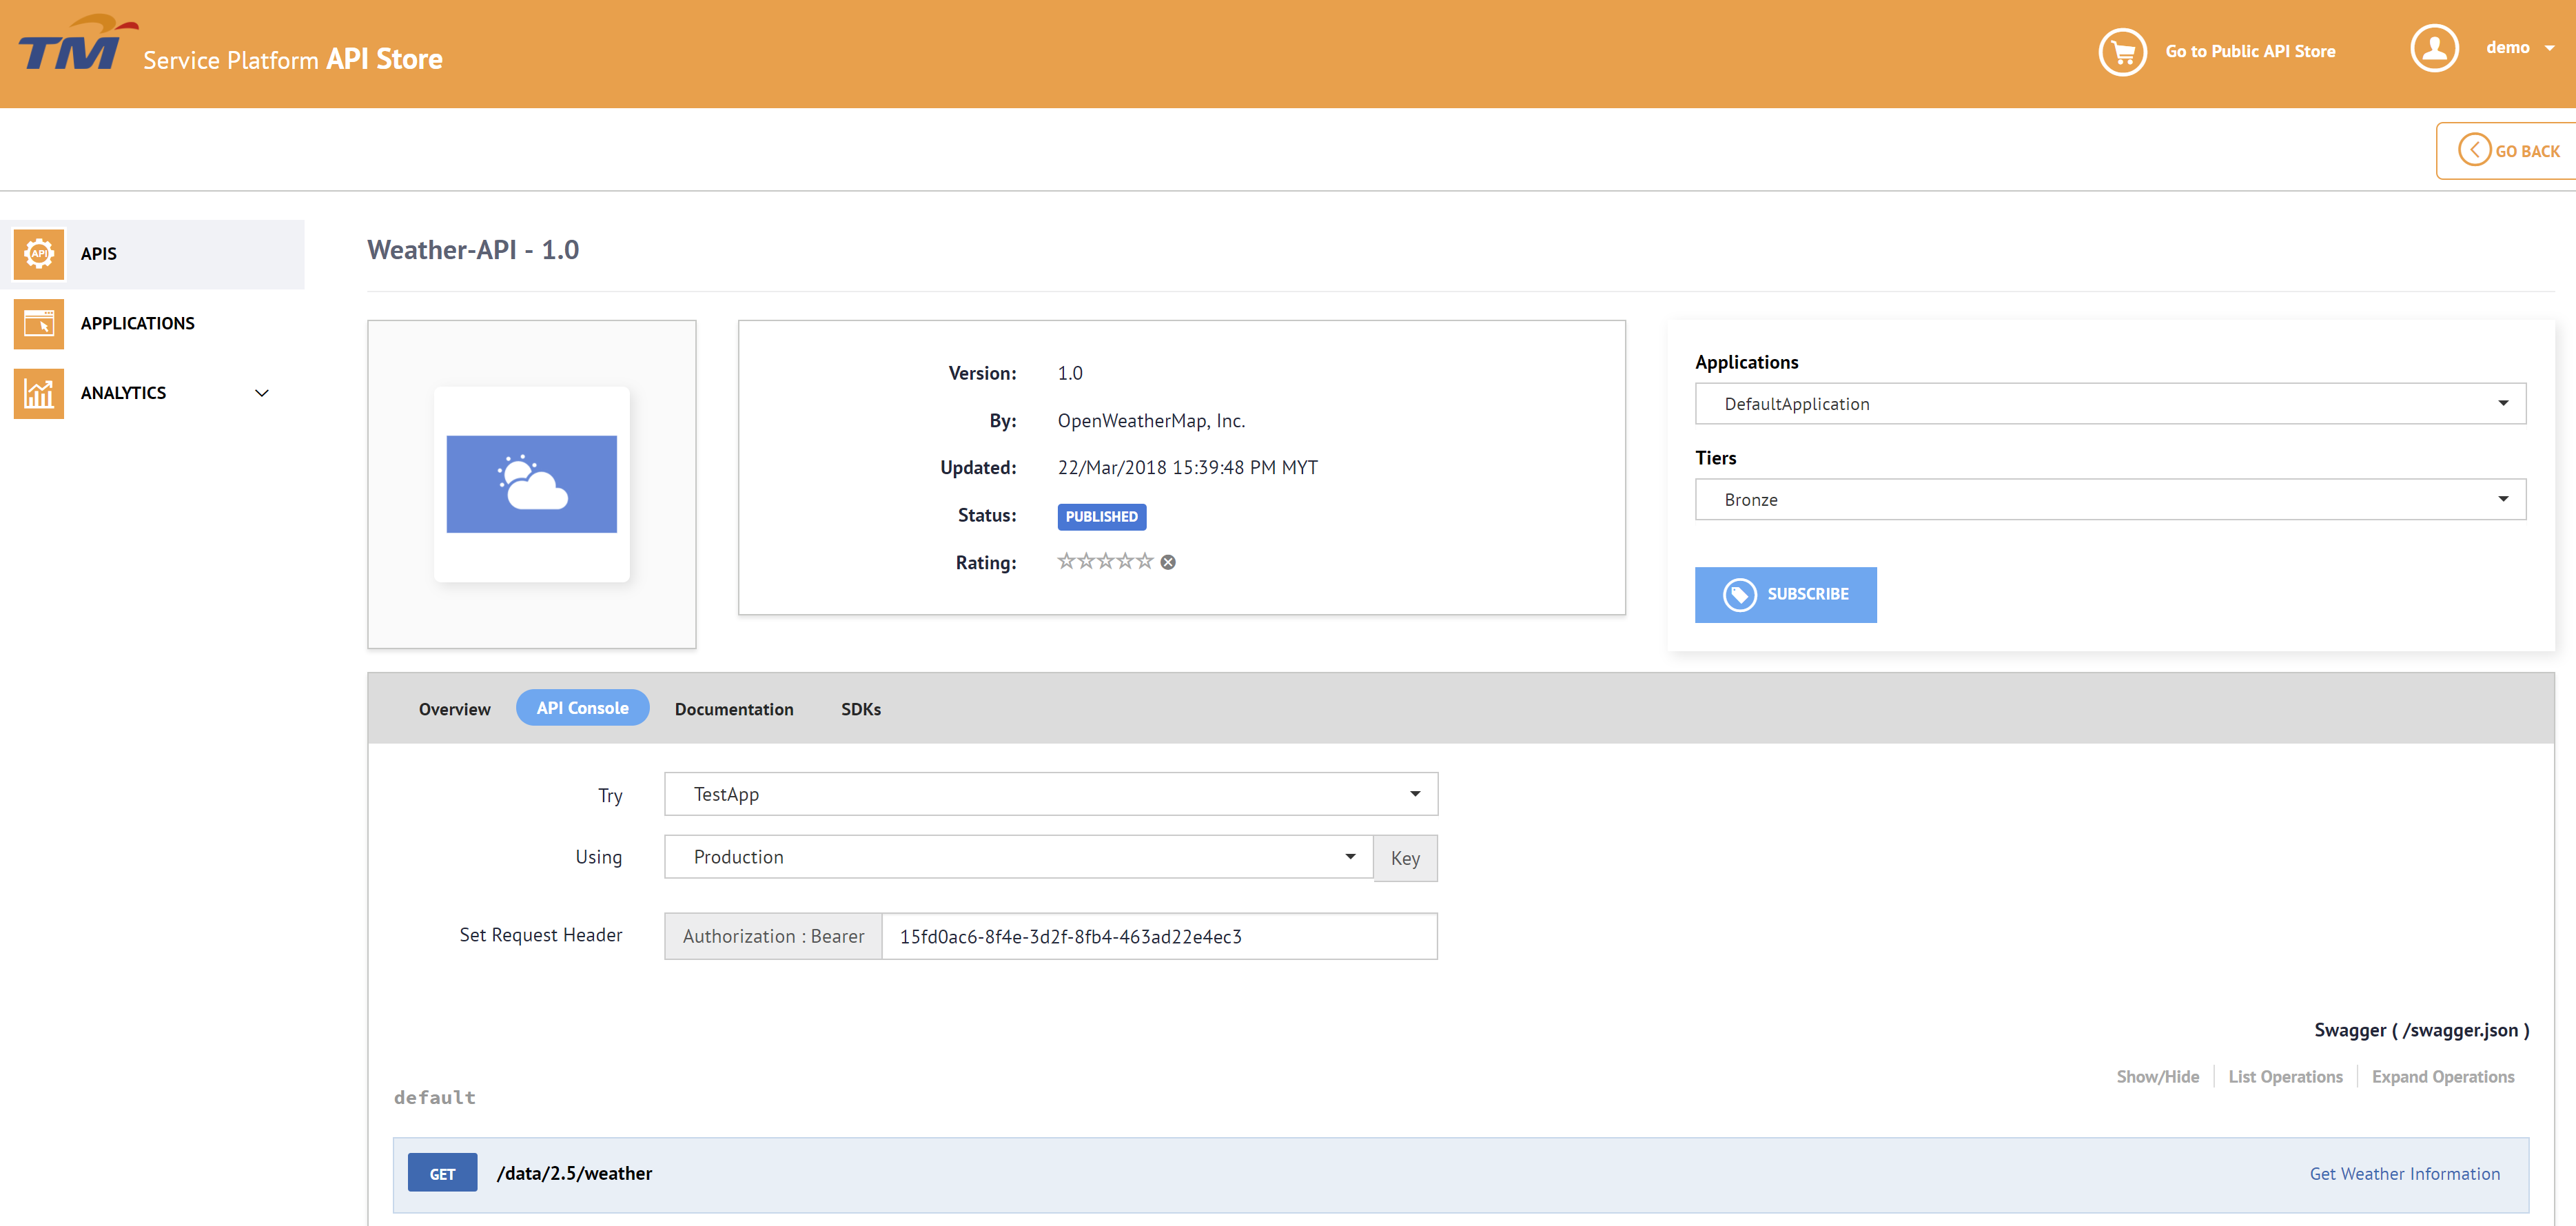
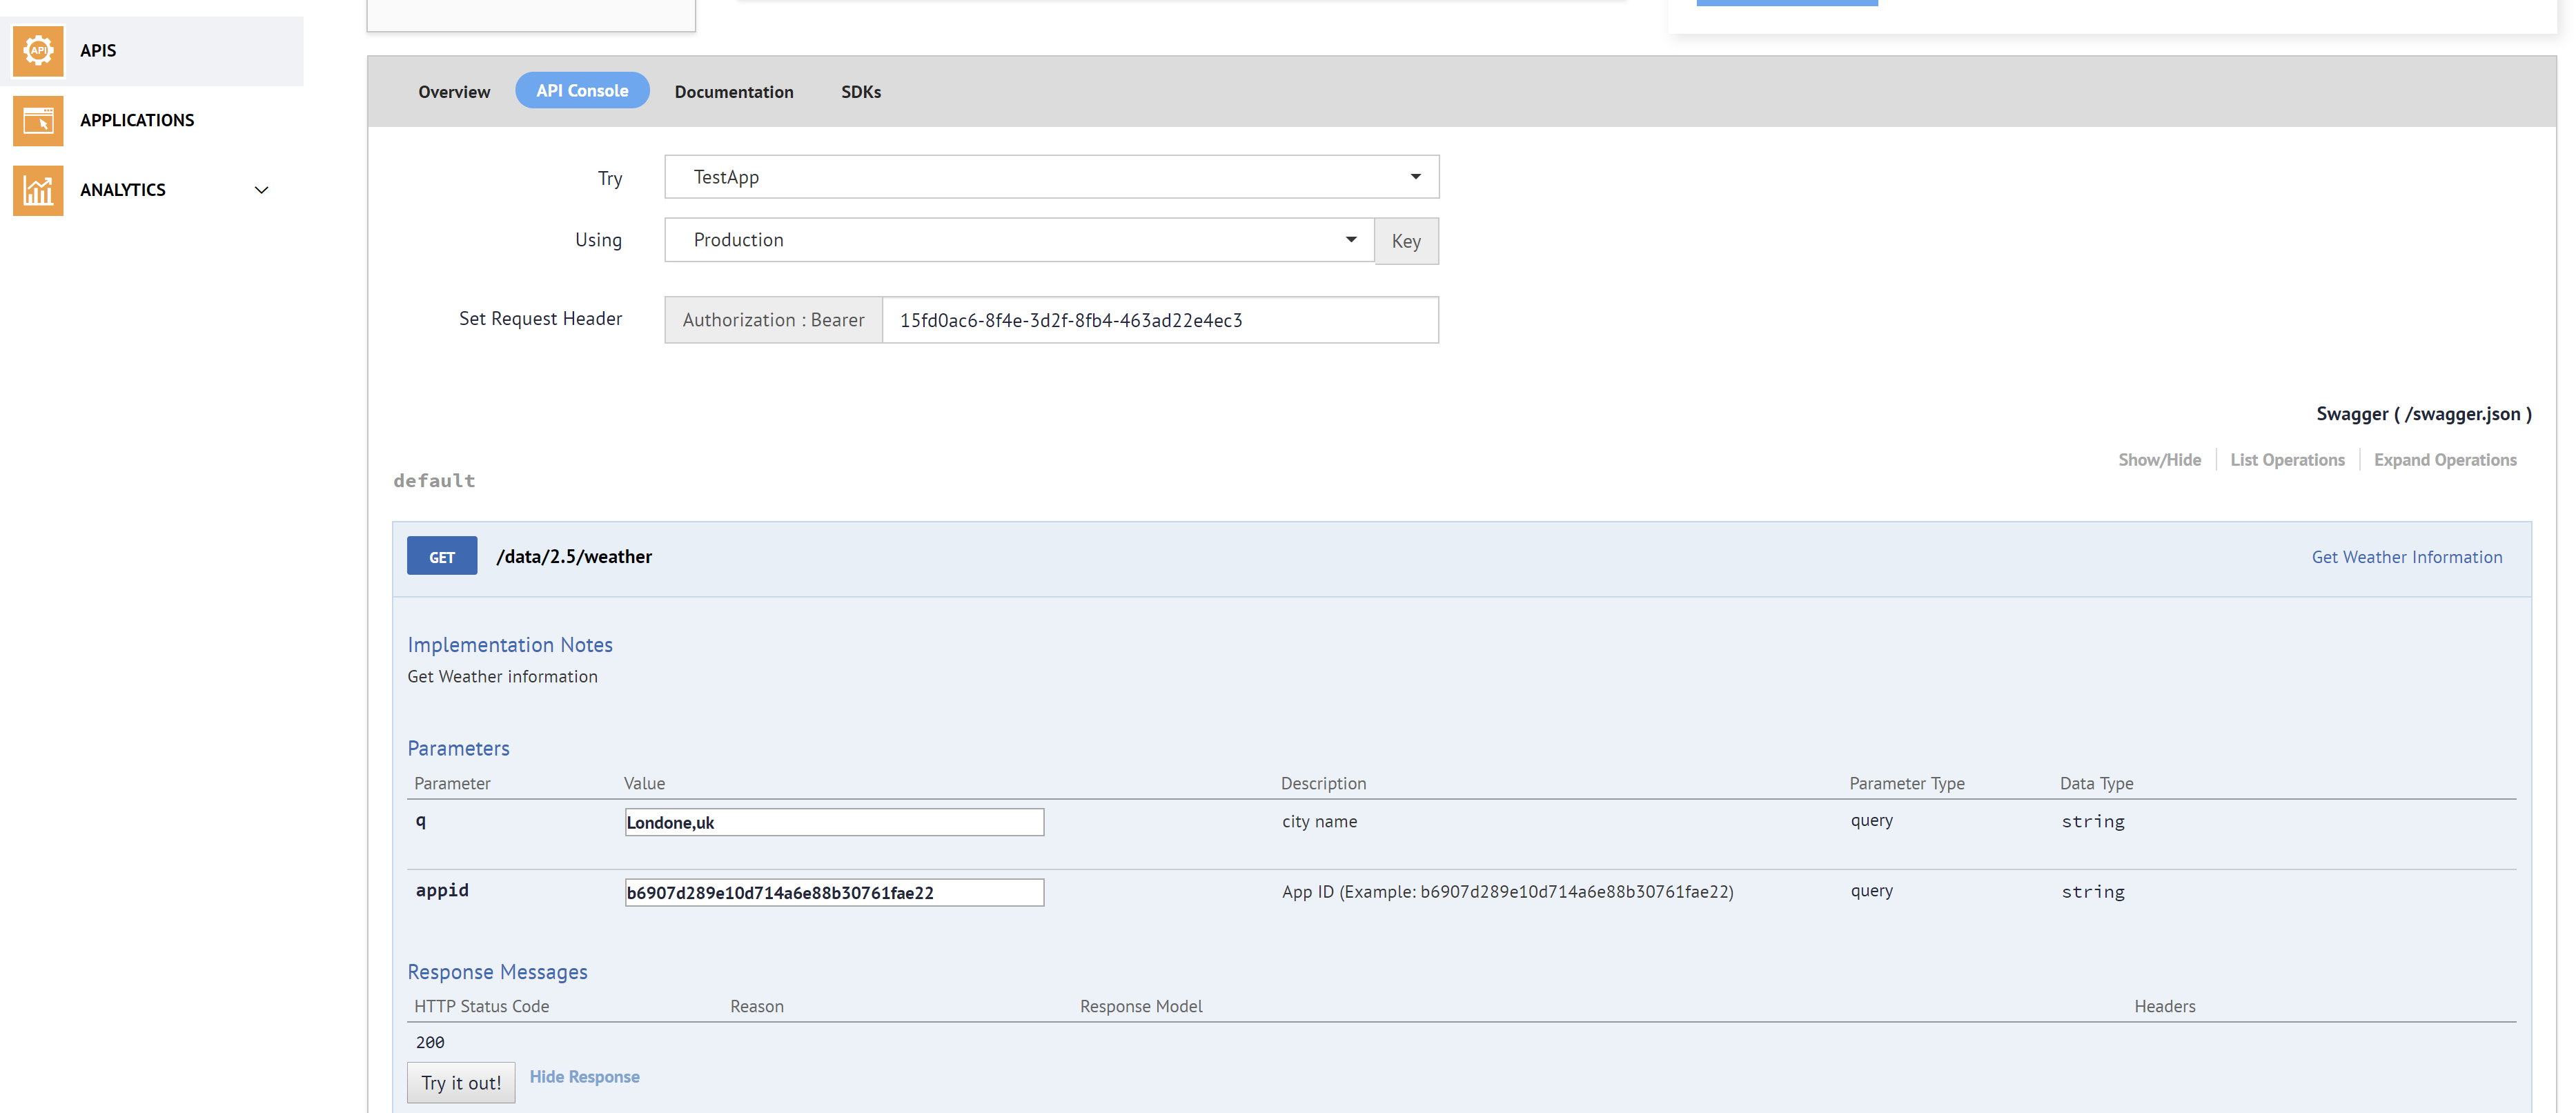
5. Expand the GET method by clicking on it, provide the required parameters and click Try it Out. For example,
| q | London,uk |
| appid | b6907d289e10d714a6e88b30761fae22 |
| Authorization | The API console is automatically populated by the access token that you generated in step 3 after subscribing to the API.The token is prefixed by the string "Bearer" as per the OAuth bearer token profile. OAuth security is enforced on all published APIs. If the application key is invalid, you get a 401 Unauthorized response in return. |
| Base URL | This appears at the bottom of the console. Using the base URL and the parameters, the system creates the API URL in the form https://api.oip.tm.com.my/{context}/version/resource/{backend_service} |
Where
- {resource} - The resource of the URL, if any.
- {backend_service} - This refers to the backend service requirements included as parameters, if any.
- For example, in the following API URL,
/infois the context,1.0.0is the version, and/data/2.5/weatheris the resource:https://api.oip.tm.com.my/info/1.0.0/data/2.5/weather?q=london&appid=b6907d289e10d714a6e88b30761fae22
Note the response for the API invocation. It will return the weather in London.
Authentication with Service Creation platform to see whether username/password valid
curl -X POST --header 'Content-Type: application/json' --header 'Accept: application/json' -d '{"username":"<email>", "password":"<password>"}' --header "Authorization: Bearer <Access Token>" 'https://api.oip.tm.com.my/iot/1.0/api/auth/login'Access Token is generated by the Service Exchange platform. Refer to previous section on how to generate the Access Token
Using data stored on Service Creation Platform from Service Exchange Platform
1. Go to https://store.oip.tm.com.my/stores/ and click on the Telekom Malaysia Research and Development store. You will see a page like shown below in the Image.
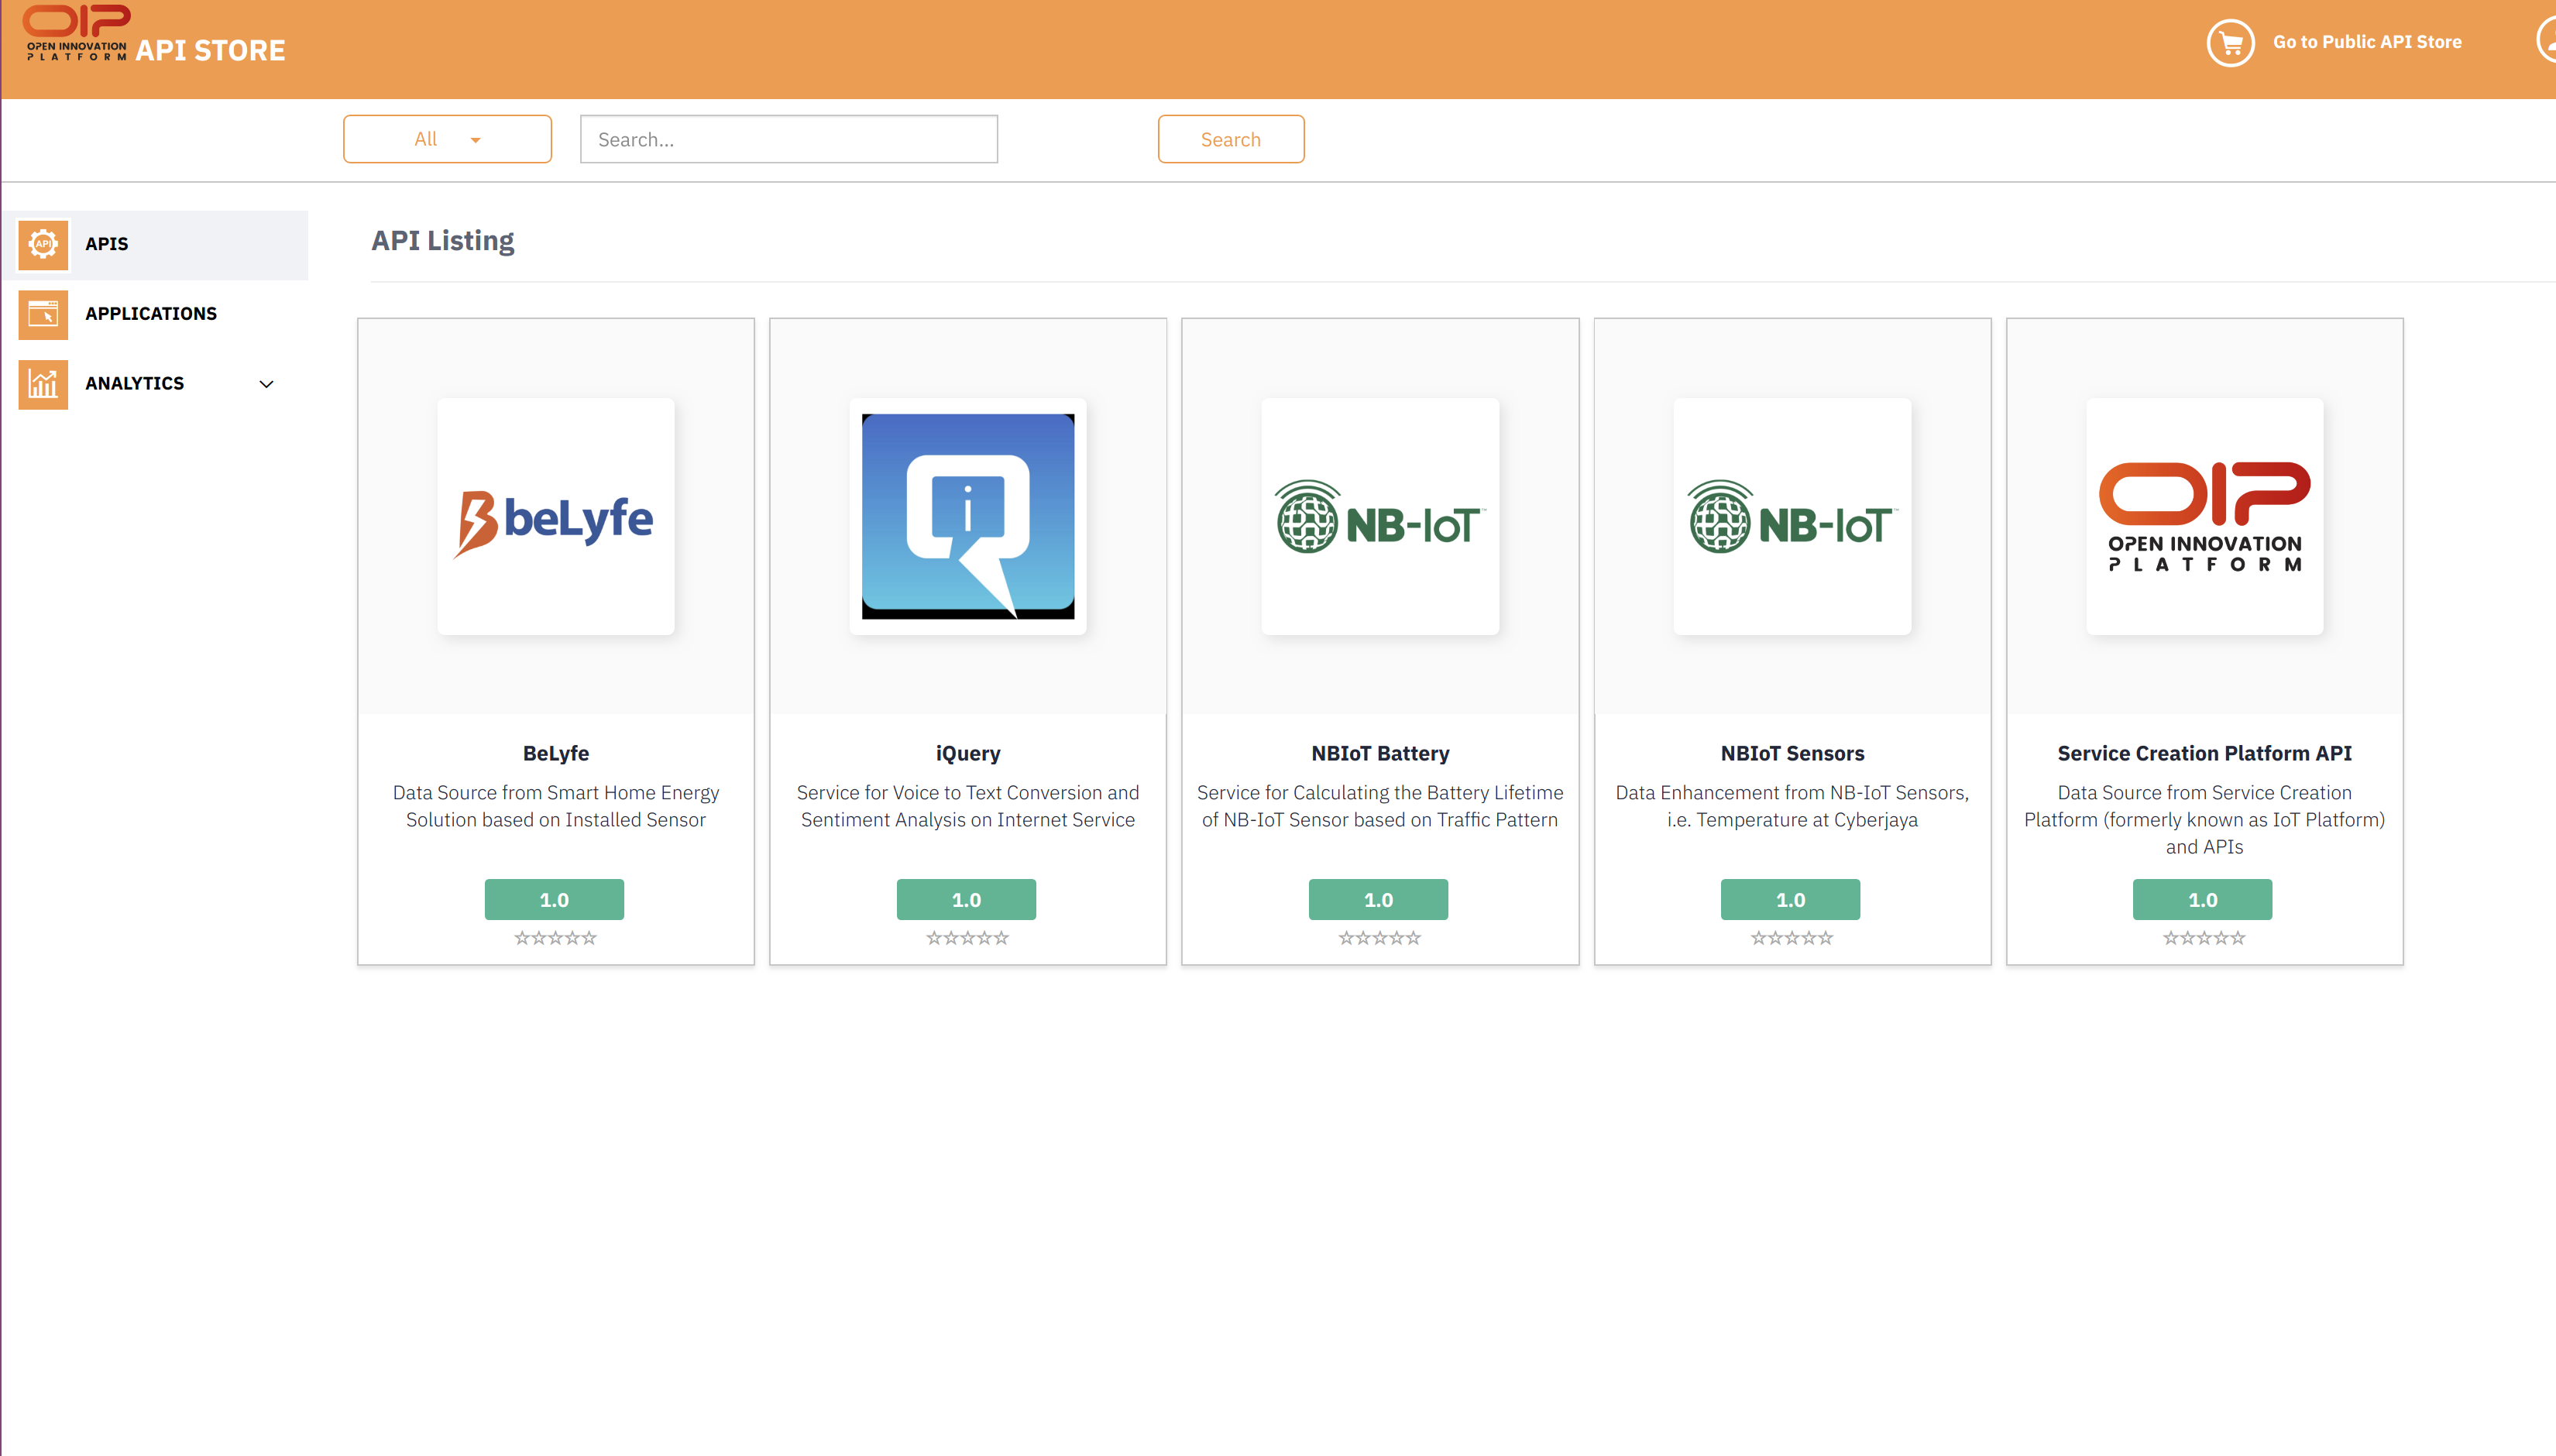
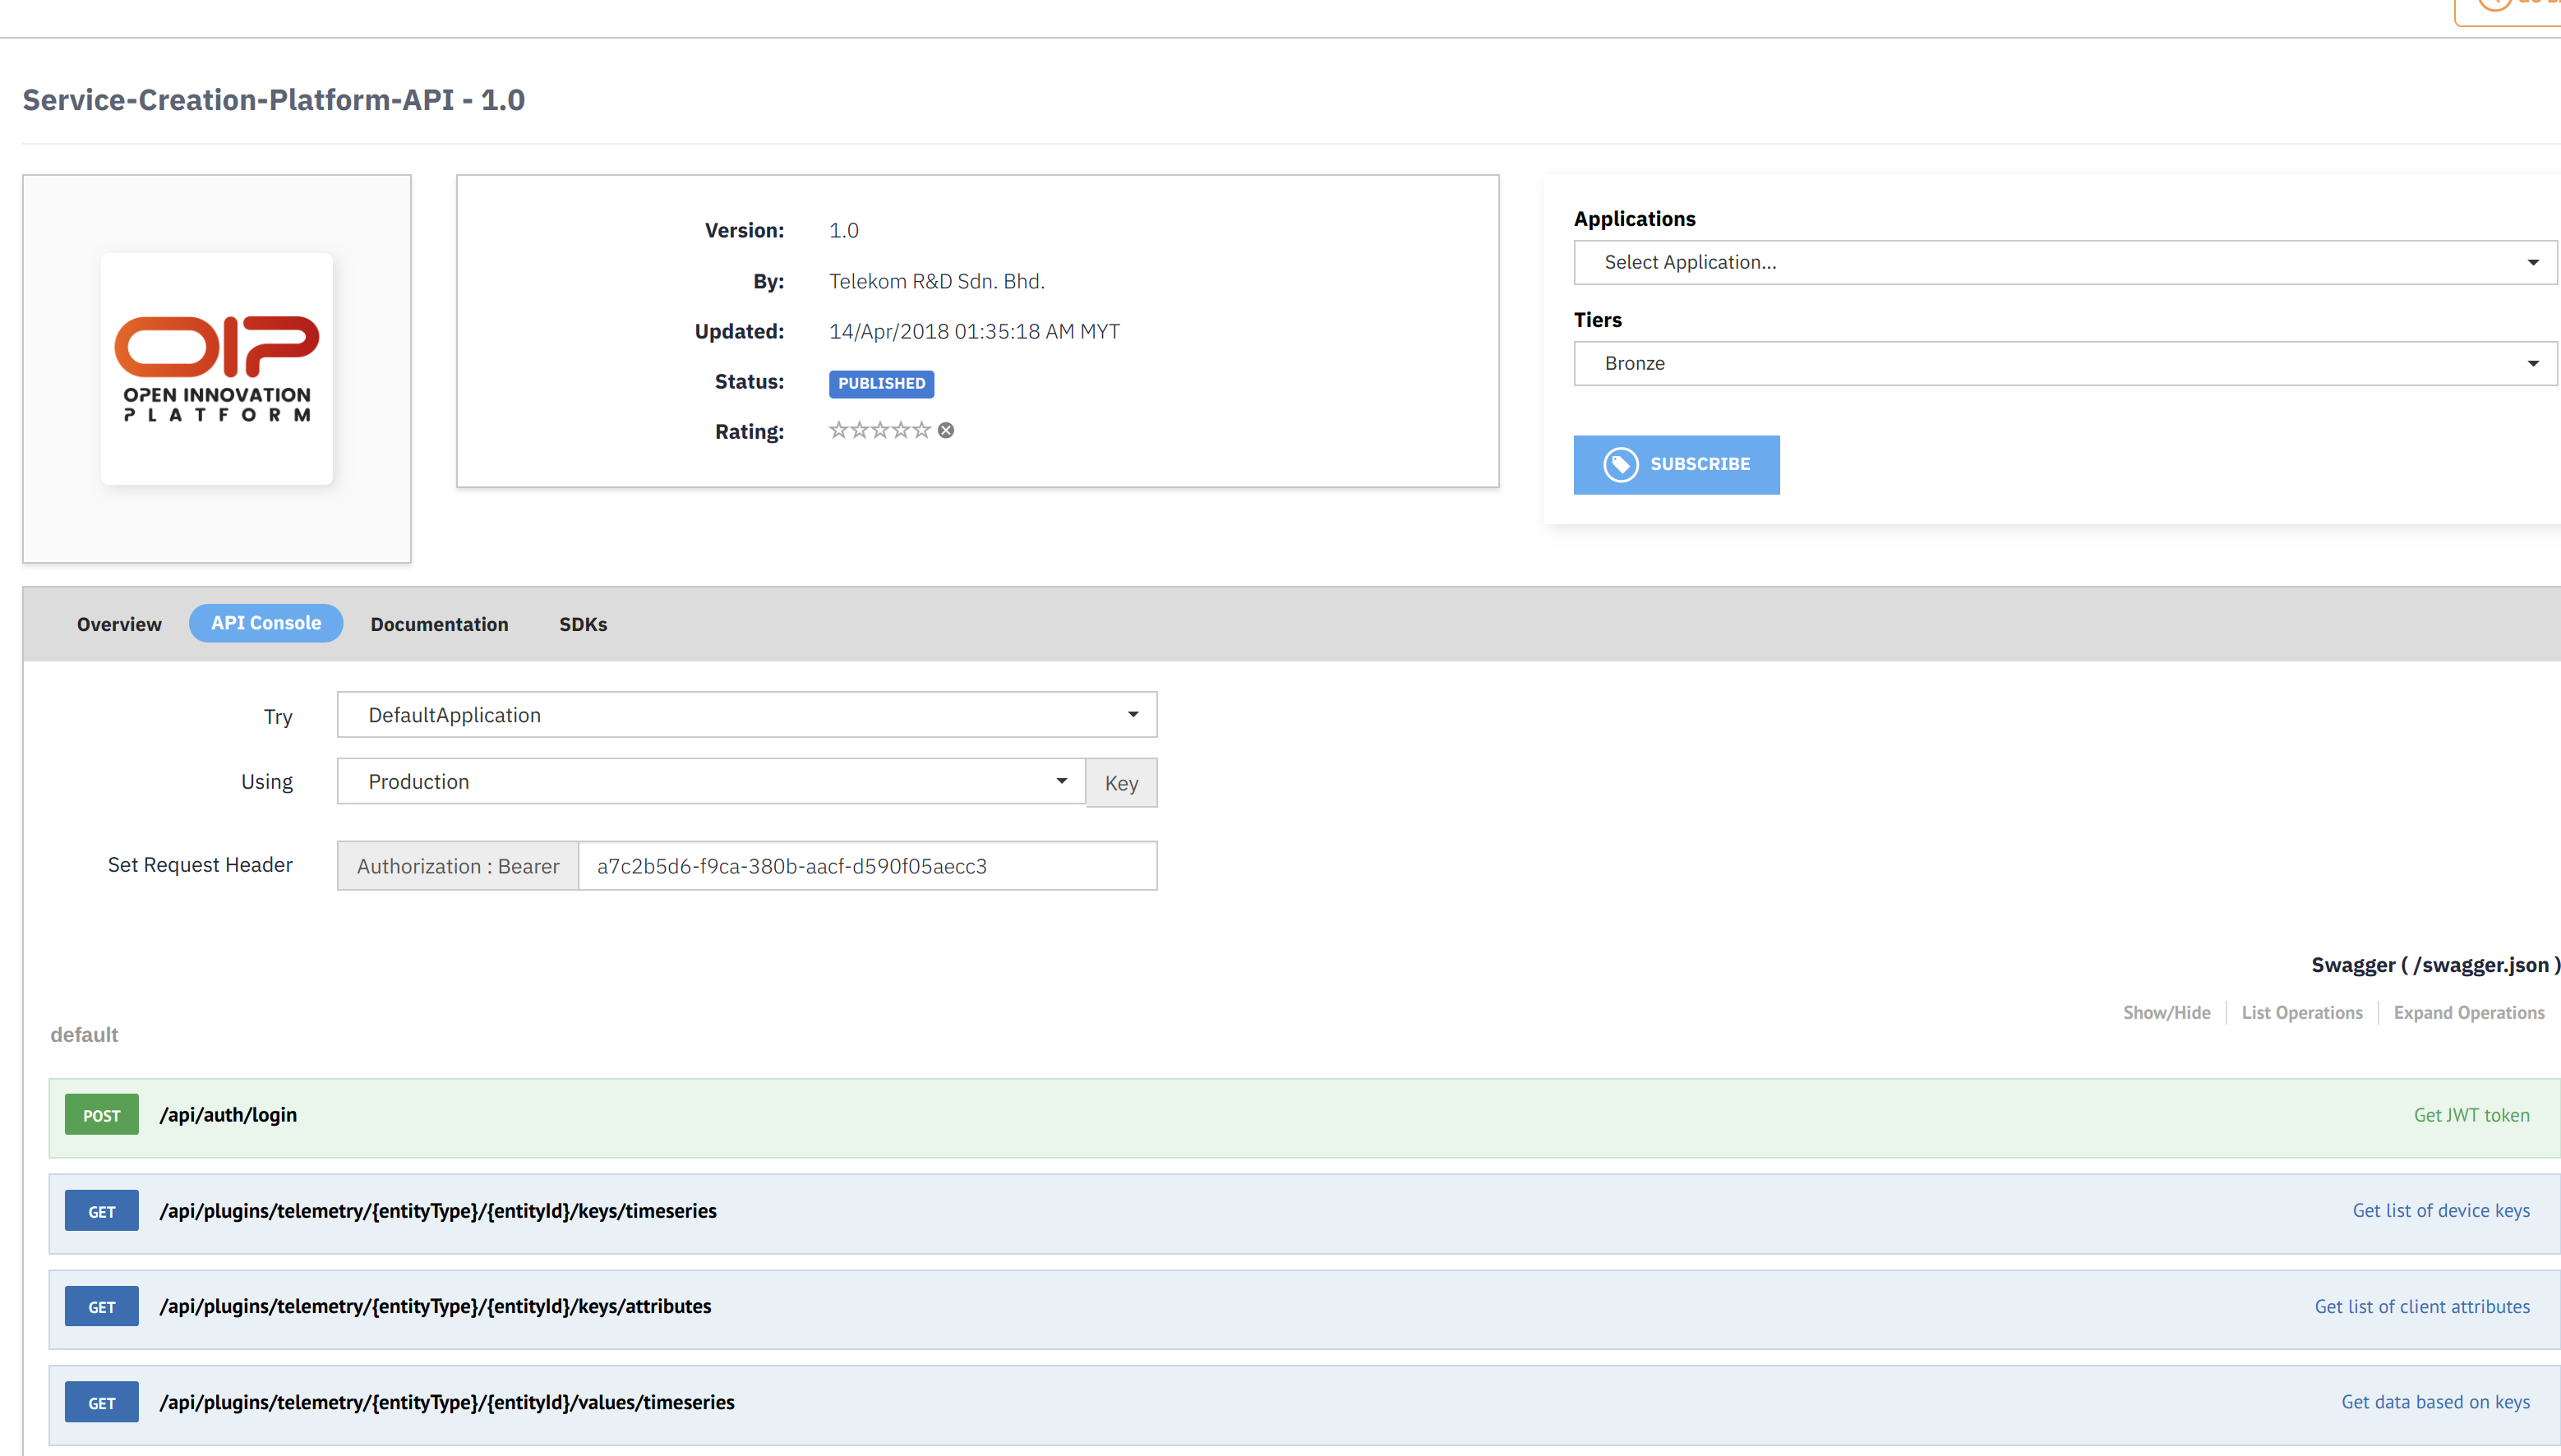
Select the service creation platform API.
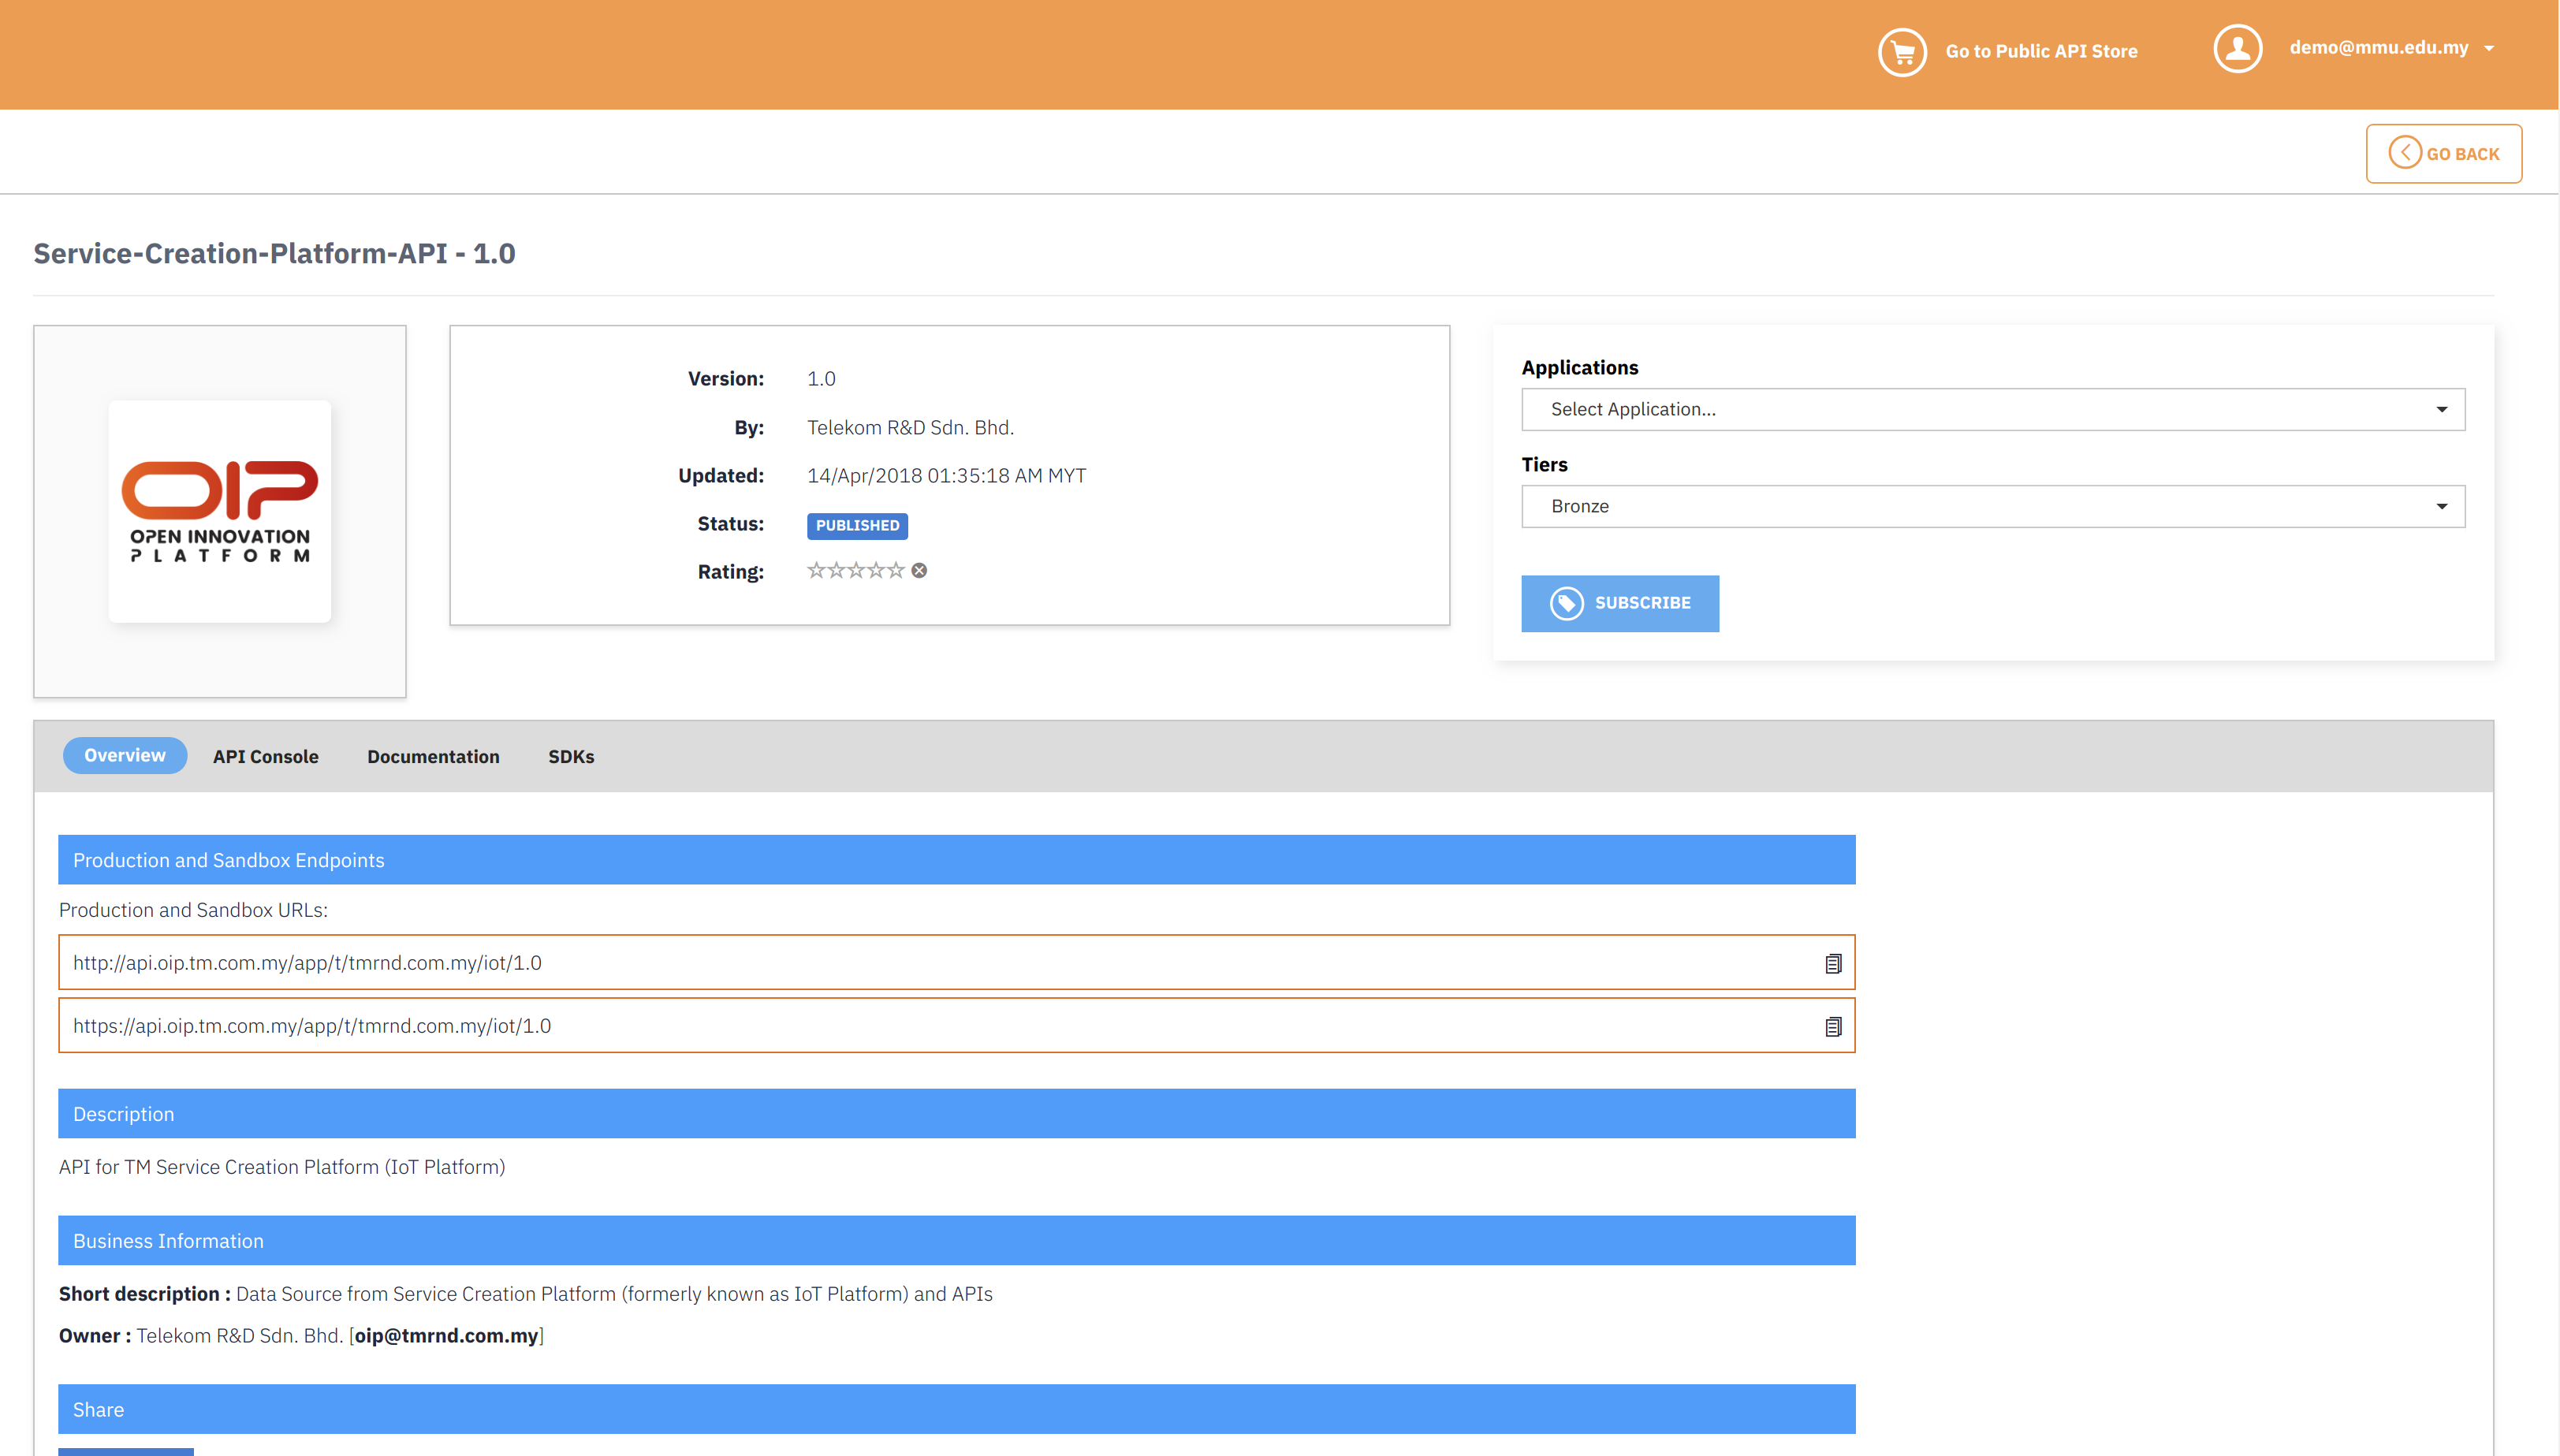
2. Subscribe to the API by clicking the subscribe button. Please note that you have to select the application first from the dropdown menu and selecting the tier also.
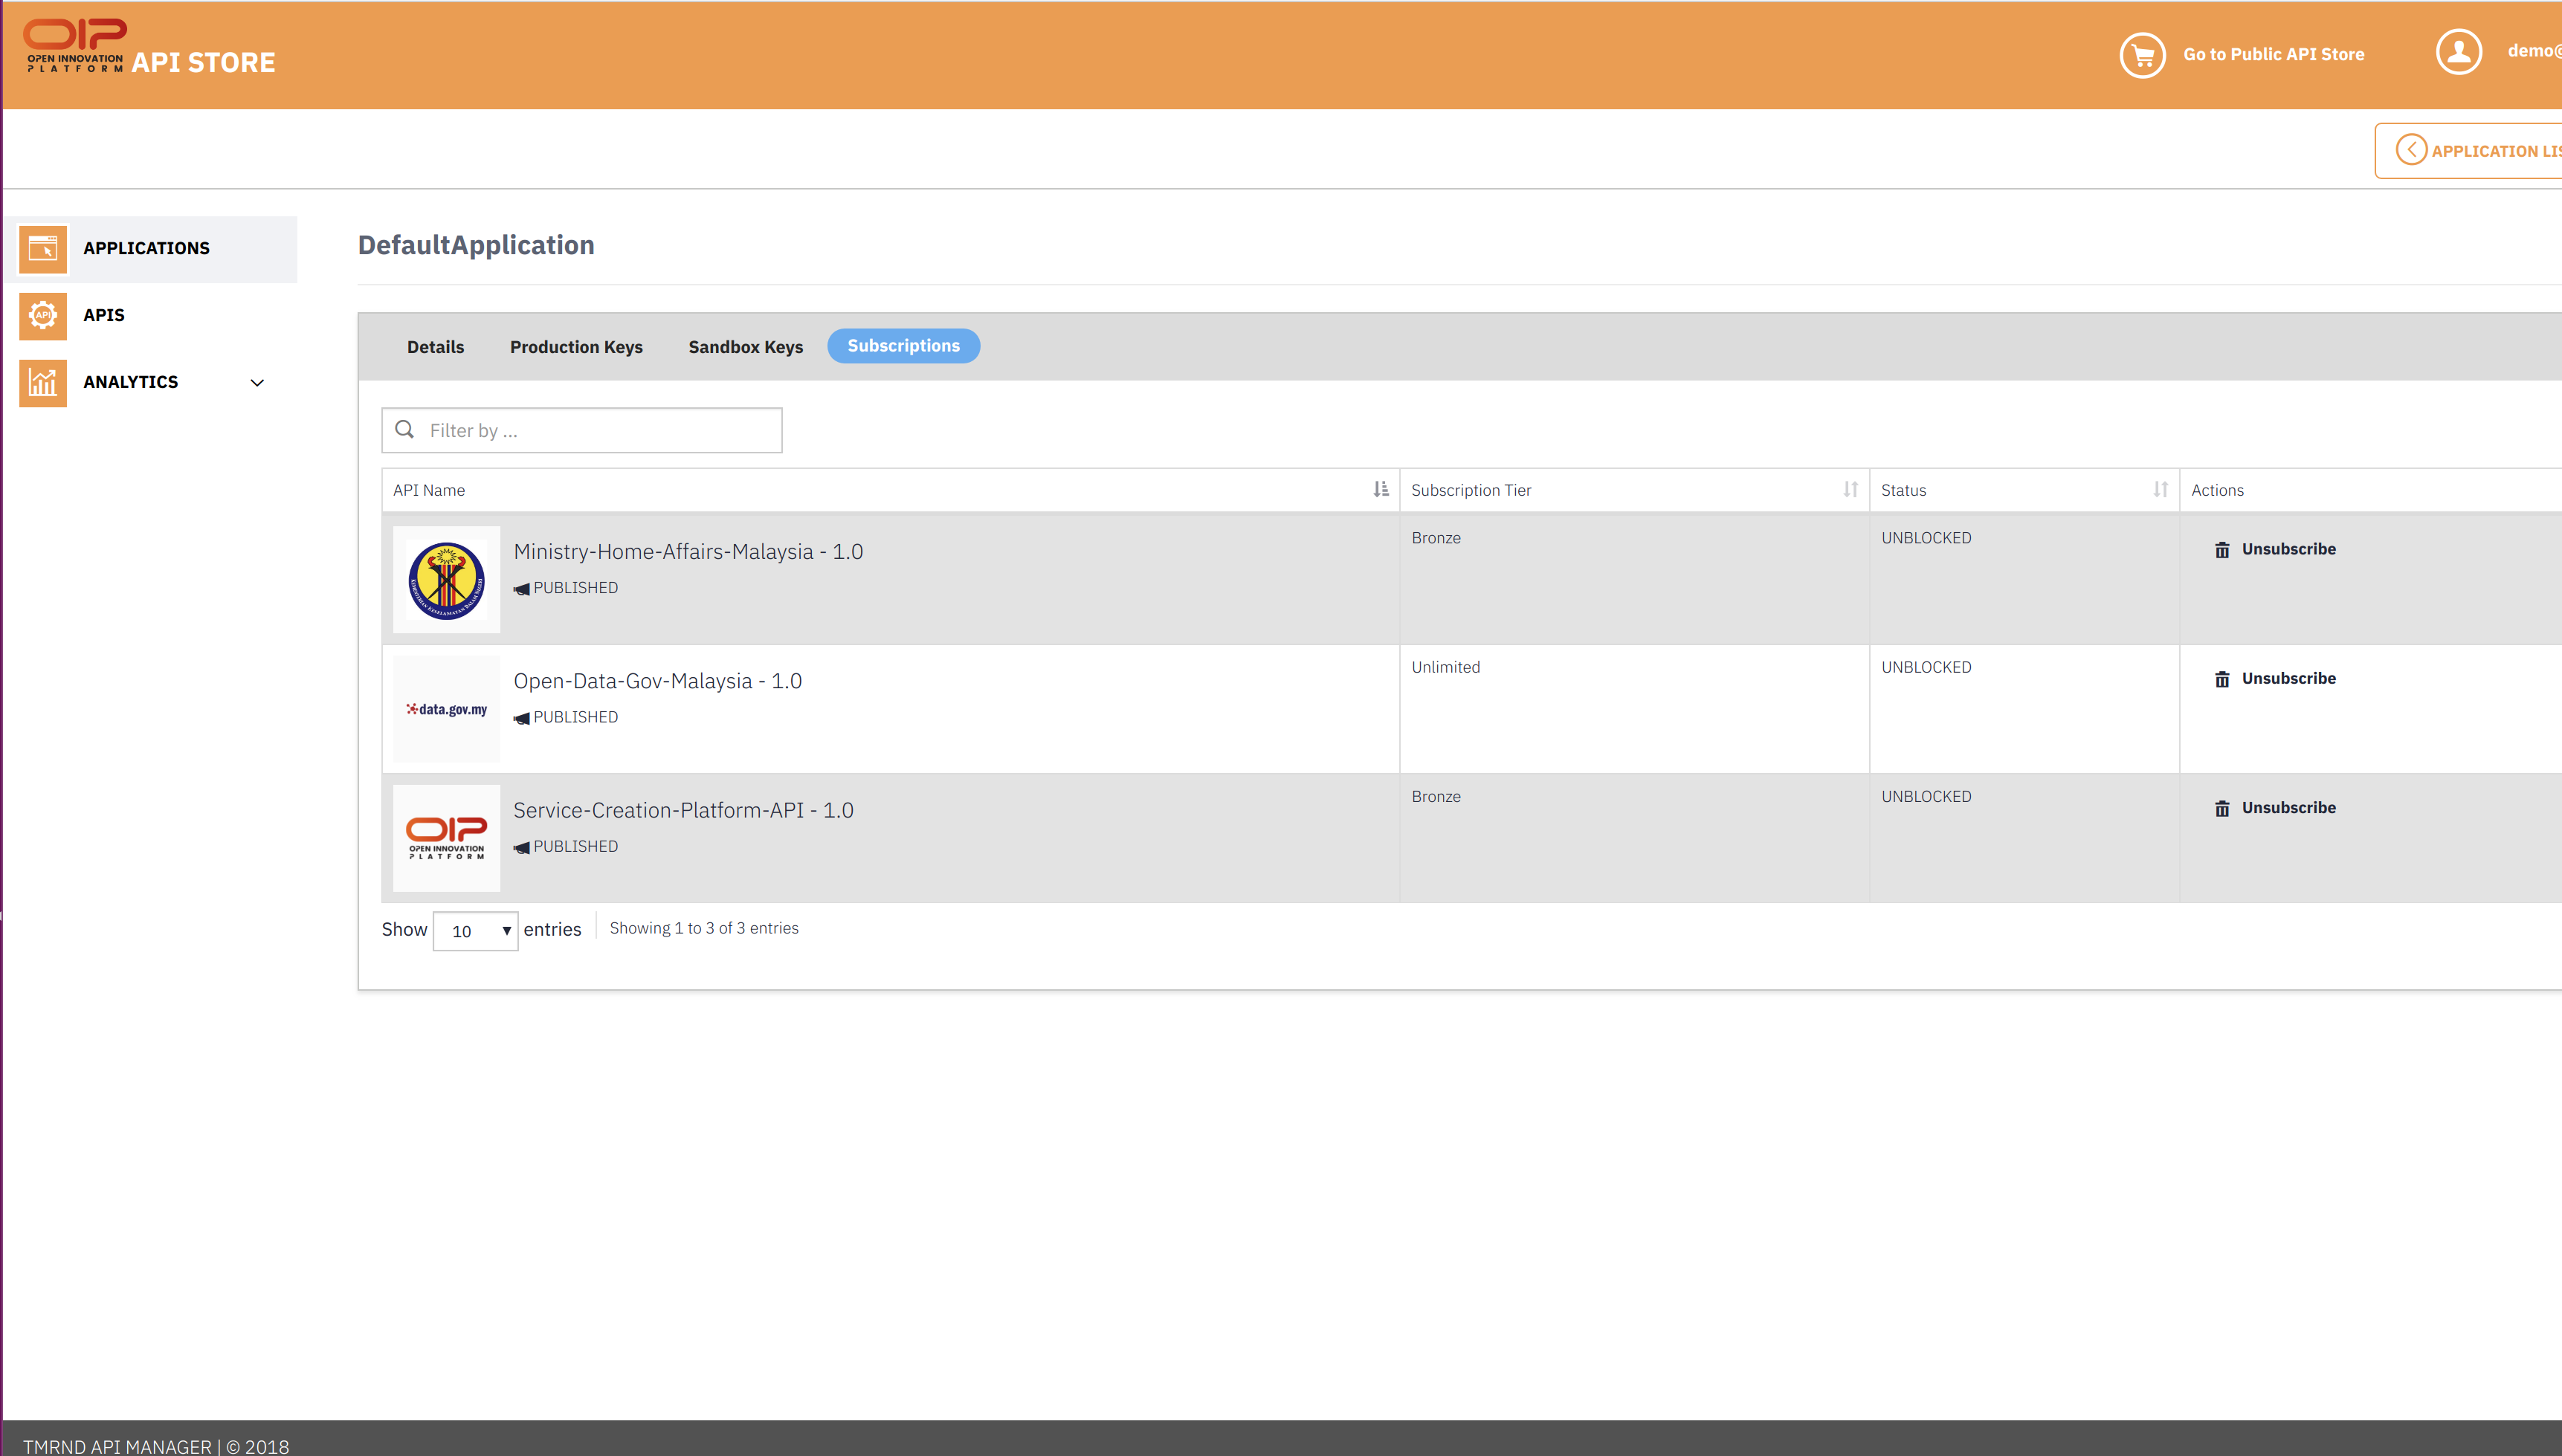
3 To see the list of application that have been created under your account click on the application tab on the left.
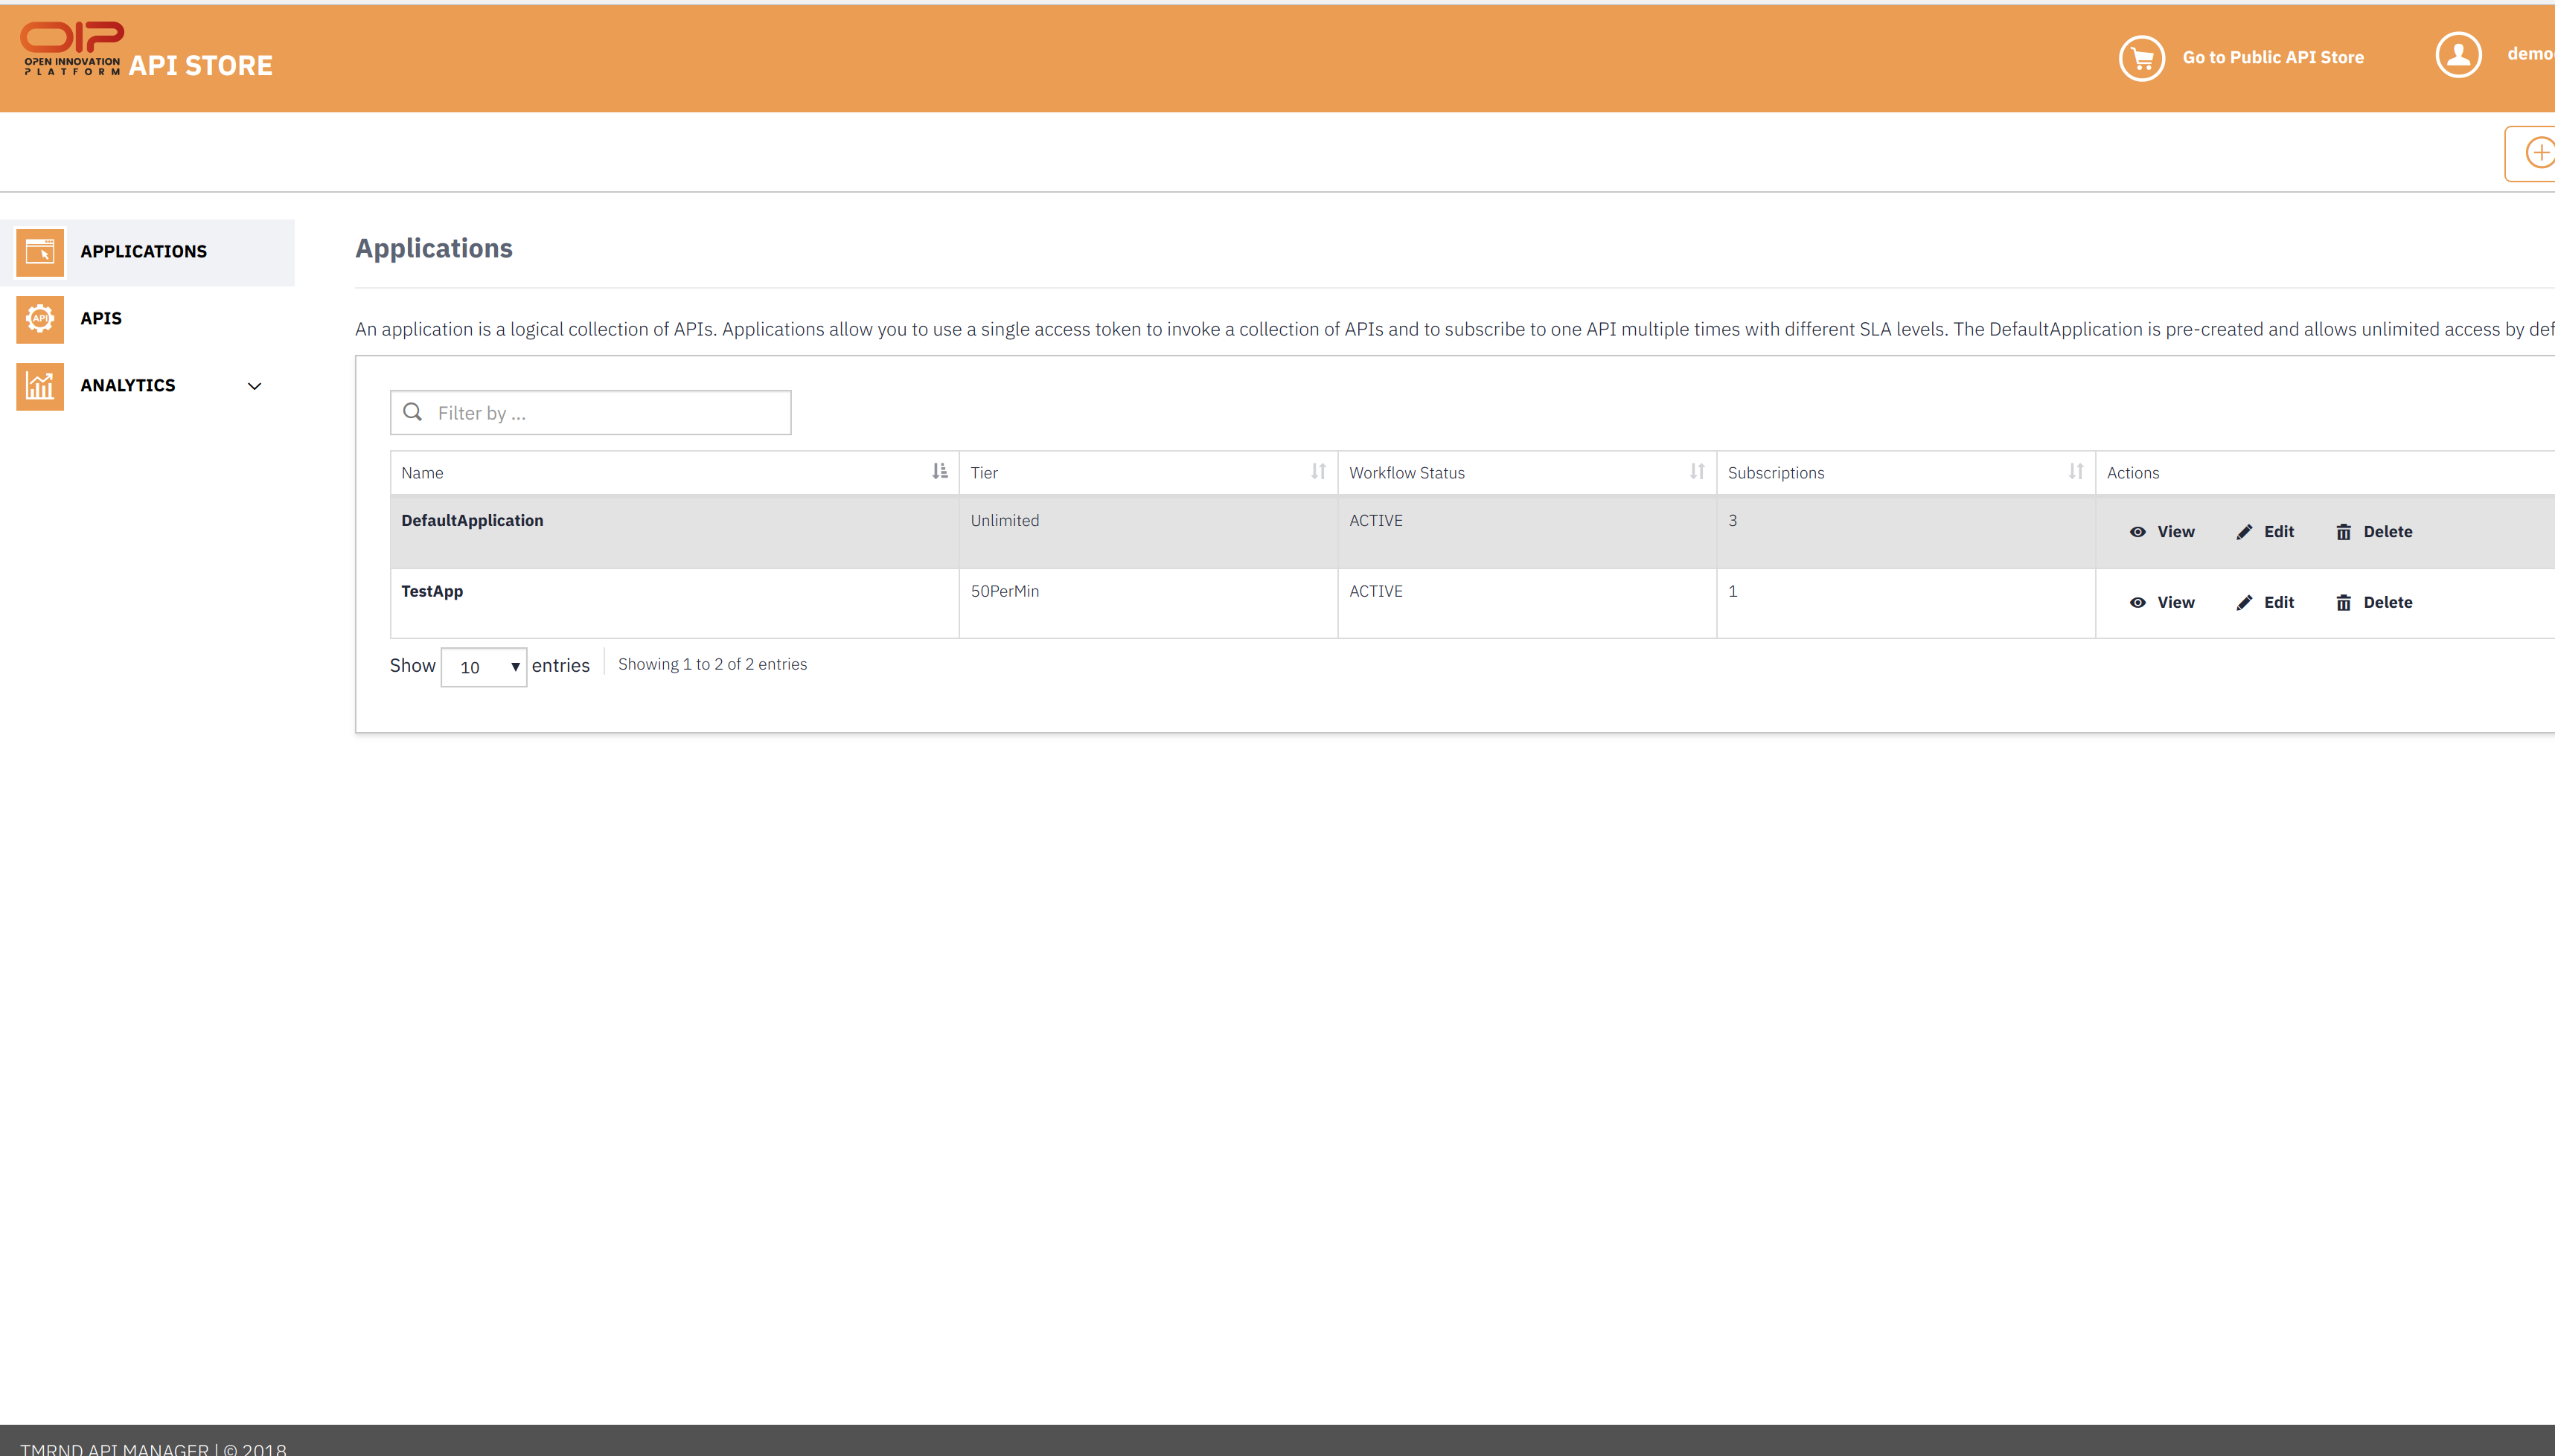
4. To see what APIs the particular application has been used to subscribe click on the view button in the list of application shown. You will see the list APIS that has been subscribed using particular application.
5. Click the Production Keys tab and click Generate Keys to create an application access token. You can use this token to invoke all APIs that you subscribe to using the same application.

6. Click on the API console tab after you have subscribed to the API and generated the access token. This will list down all the API that you can use.
7. To use the first API which provides you the token to use service creation platform you need to provide the username and password in JSON format as shown.
{
"username" : "demo@mmu.edu.my"
"password" : "Demo_123"
}
Enter the above information in the payload box.
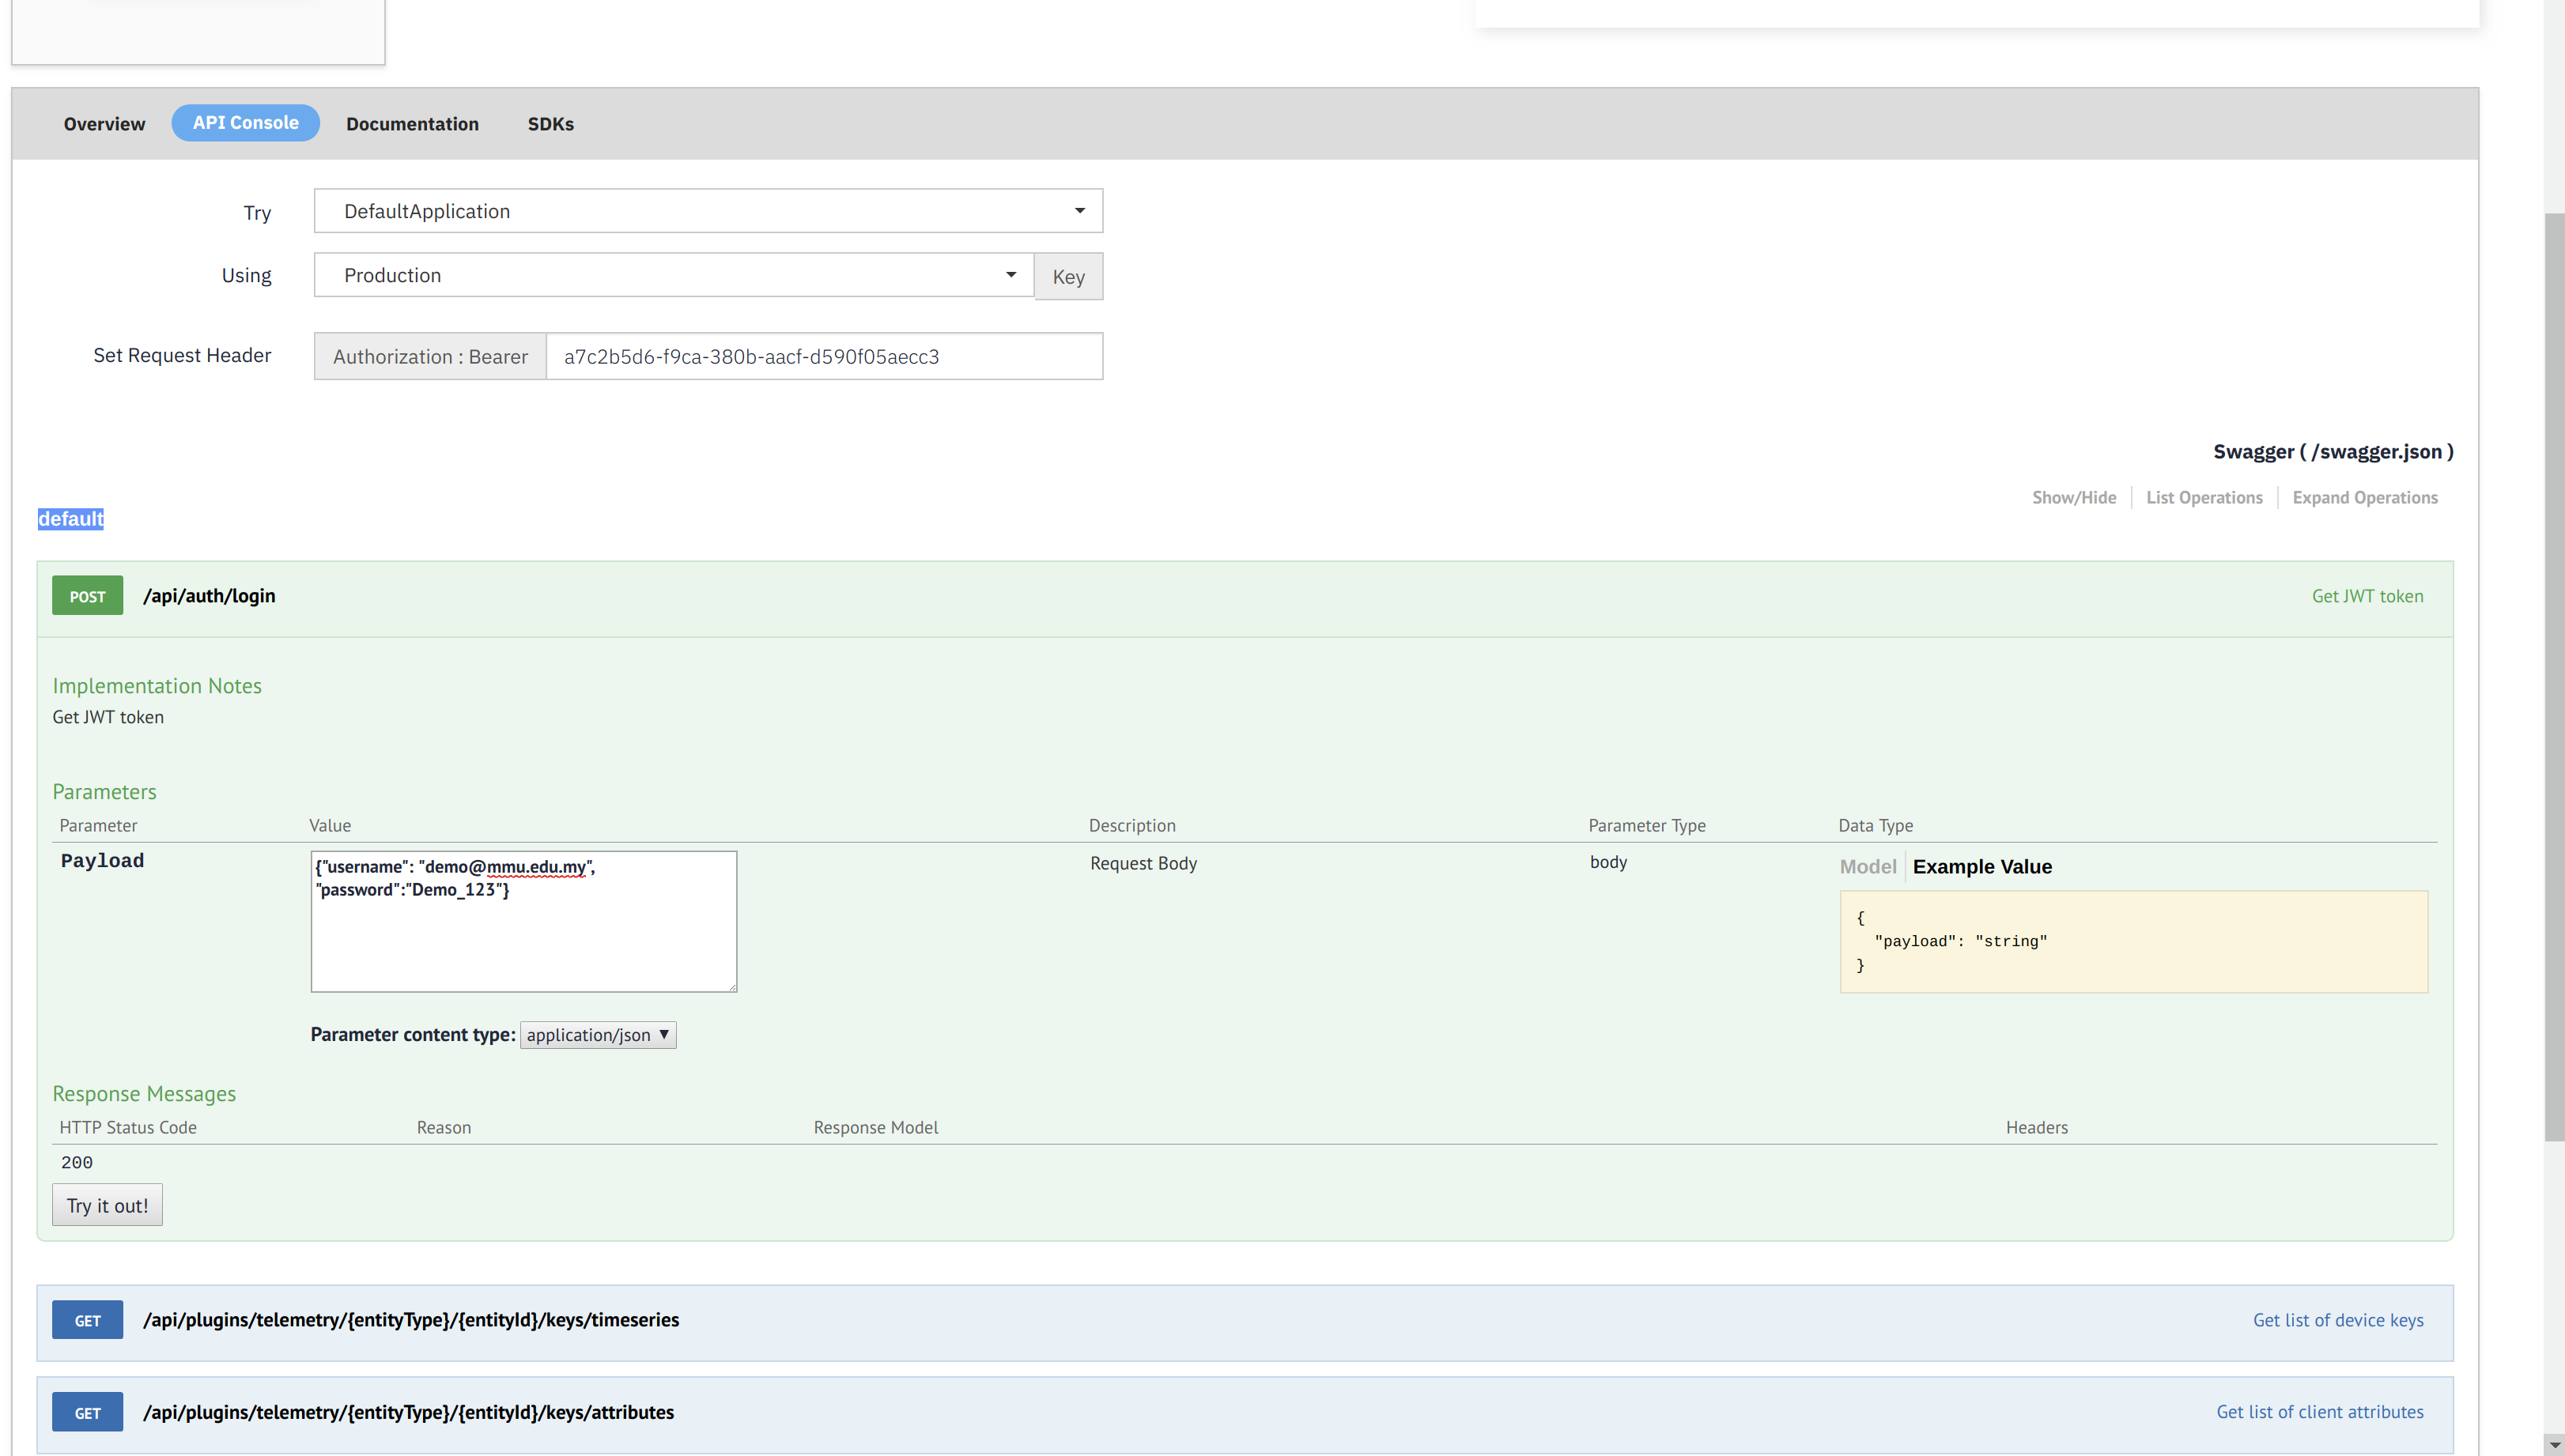
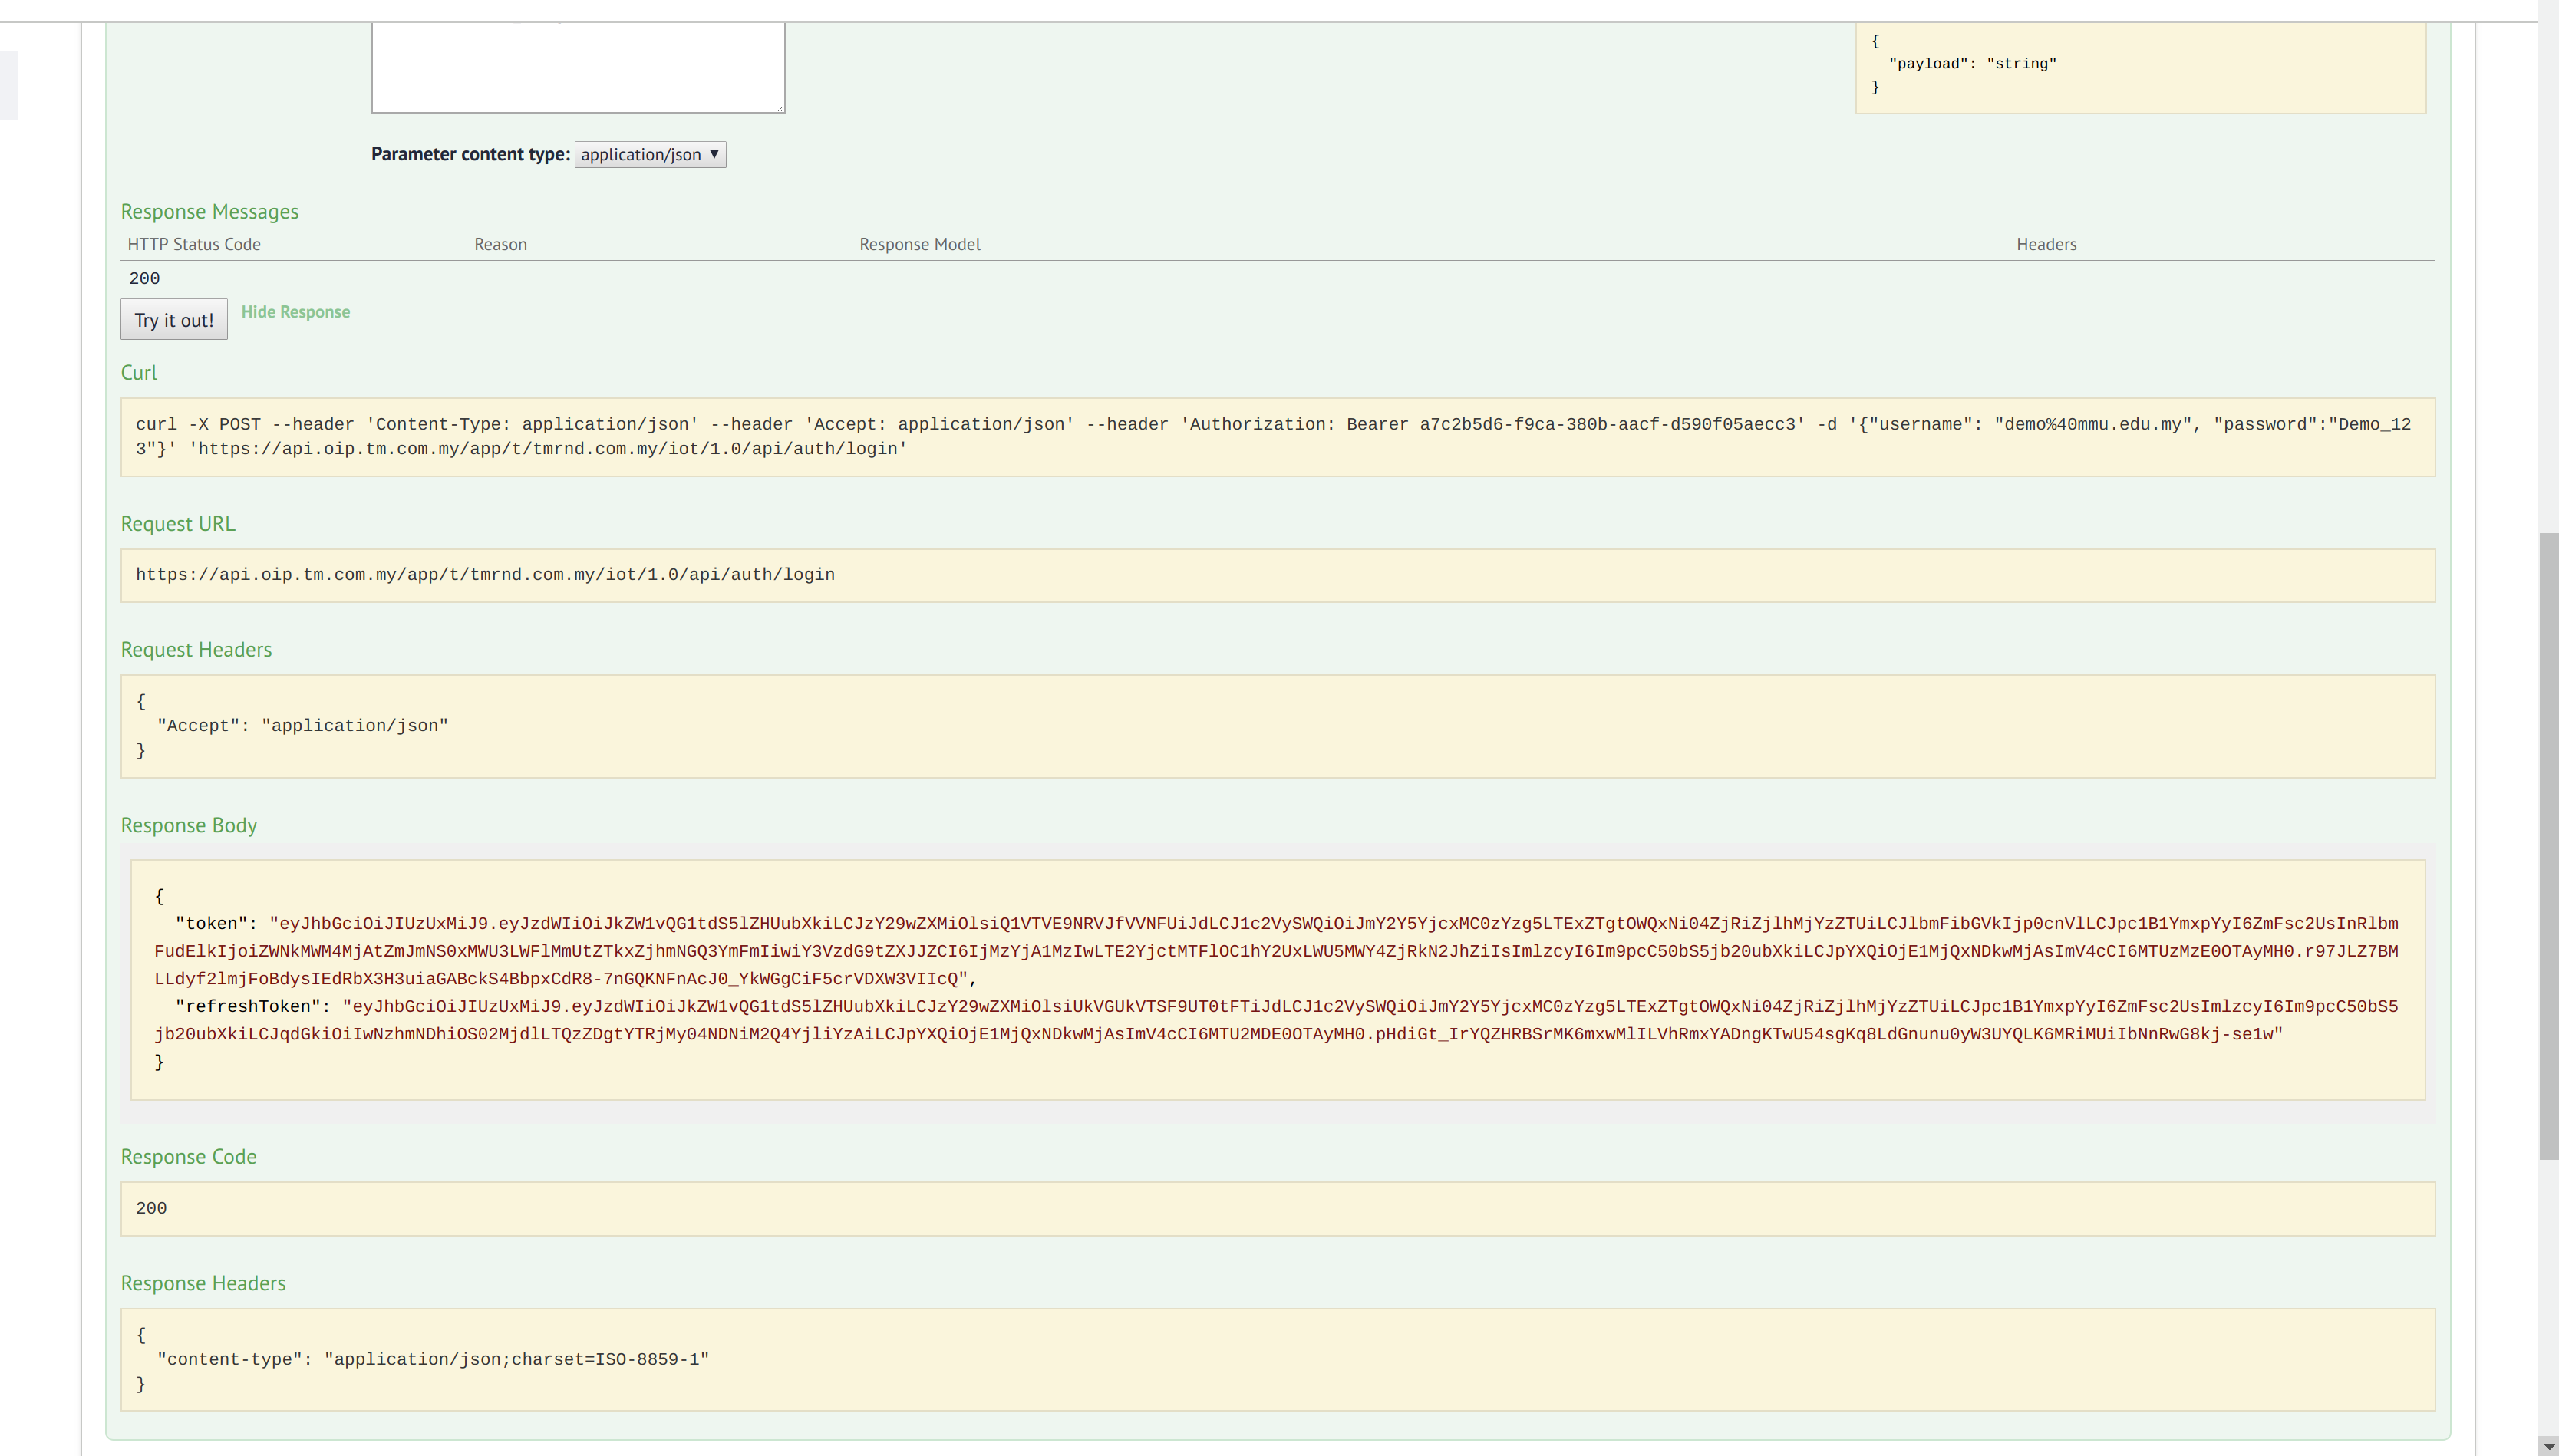
8. After entering the JSON information in the payload box click the try it out button. You should get the access token in the response body.
9. The next API is used to get timeseries data keys. You need to enter three information entity type, entityid and X-Authorization as shown. X-Authorization is the access token you received in the previous API.
X-Authorization : Bearer <Your access token>

entityType can be:  TENANT, CUSTOMER, USER, RULE, PLUGIN, DASHBOARD, ASSET, DEVICE, ALARM

entityID is unique id of the device that you will get from service creation platform dashboard.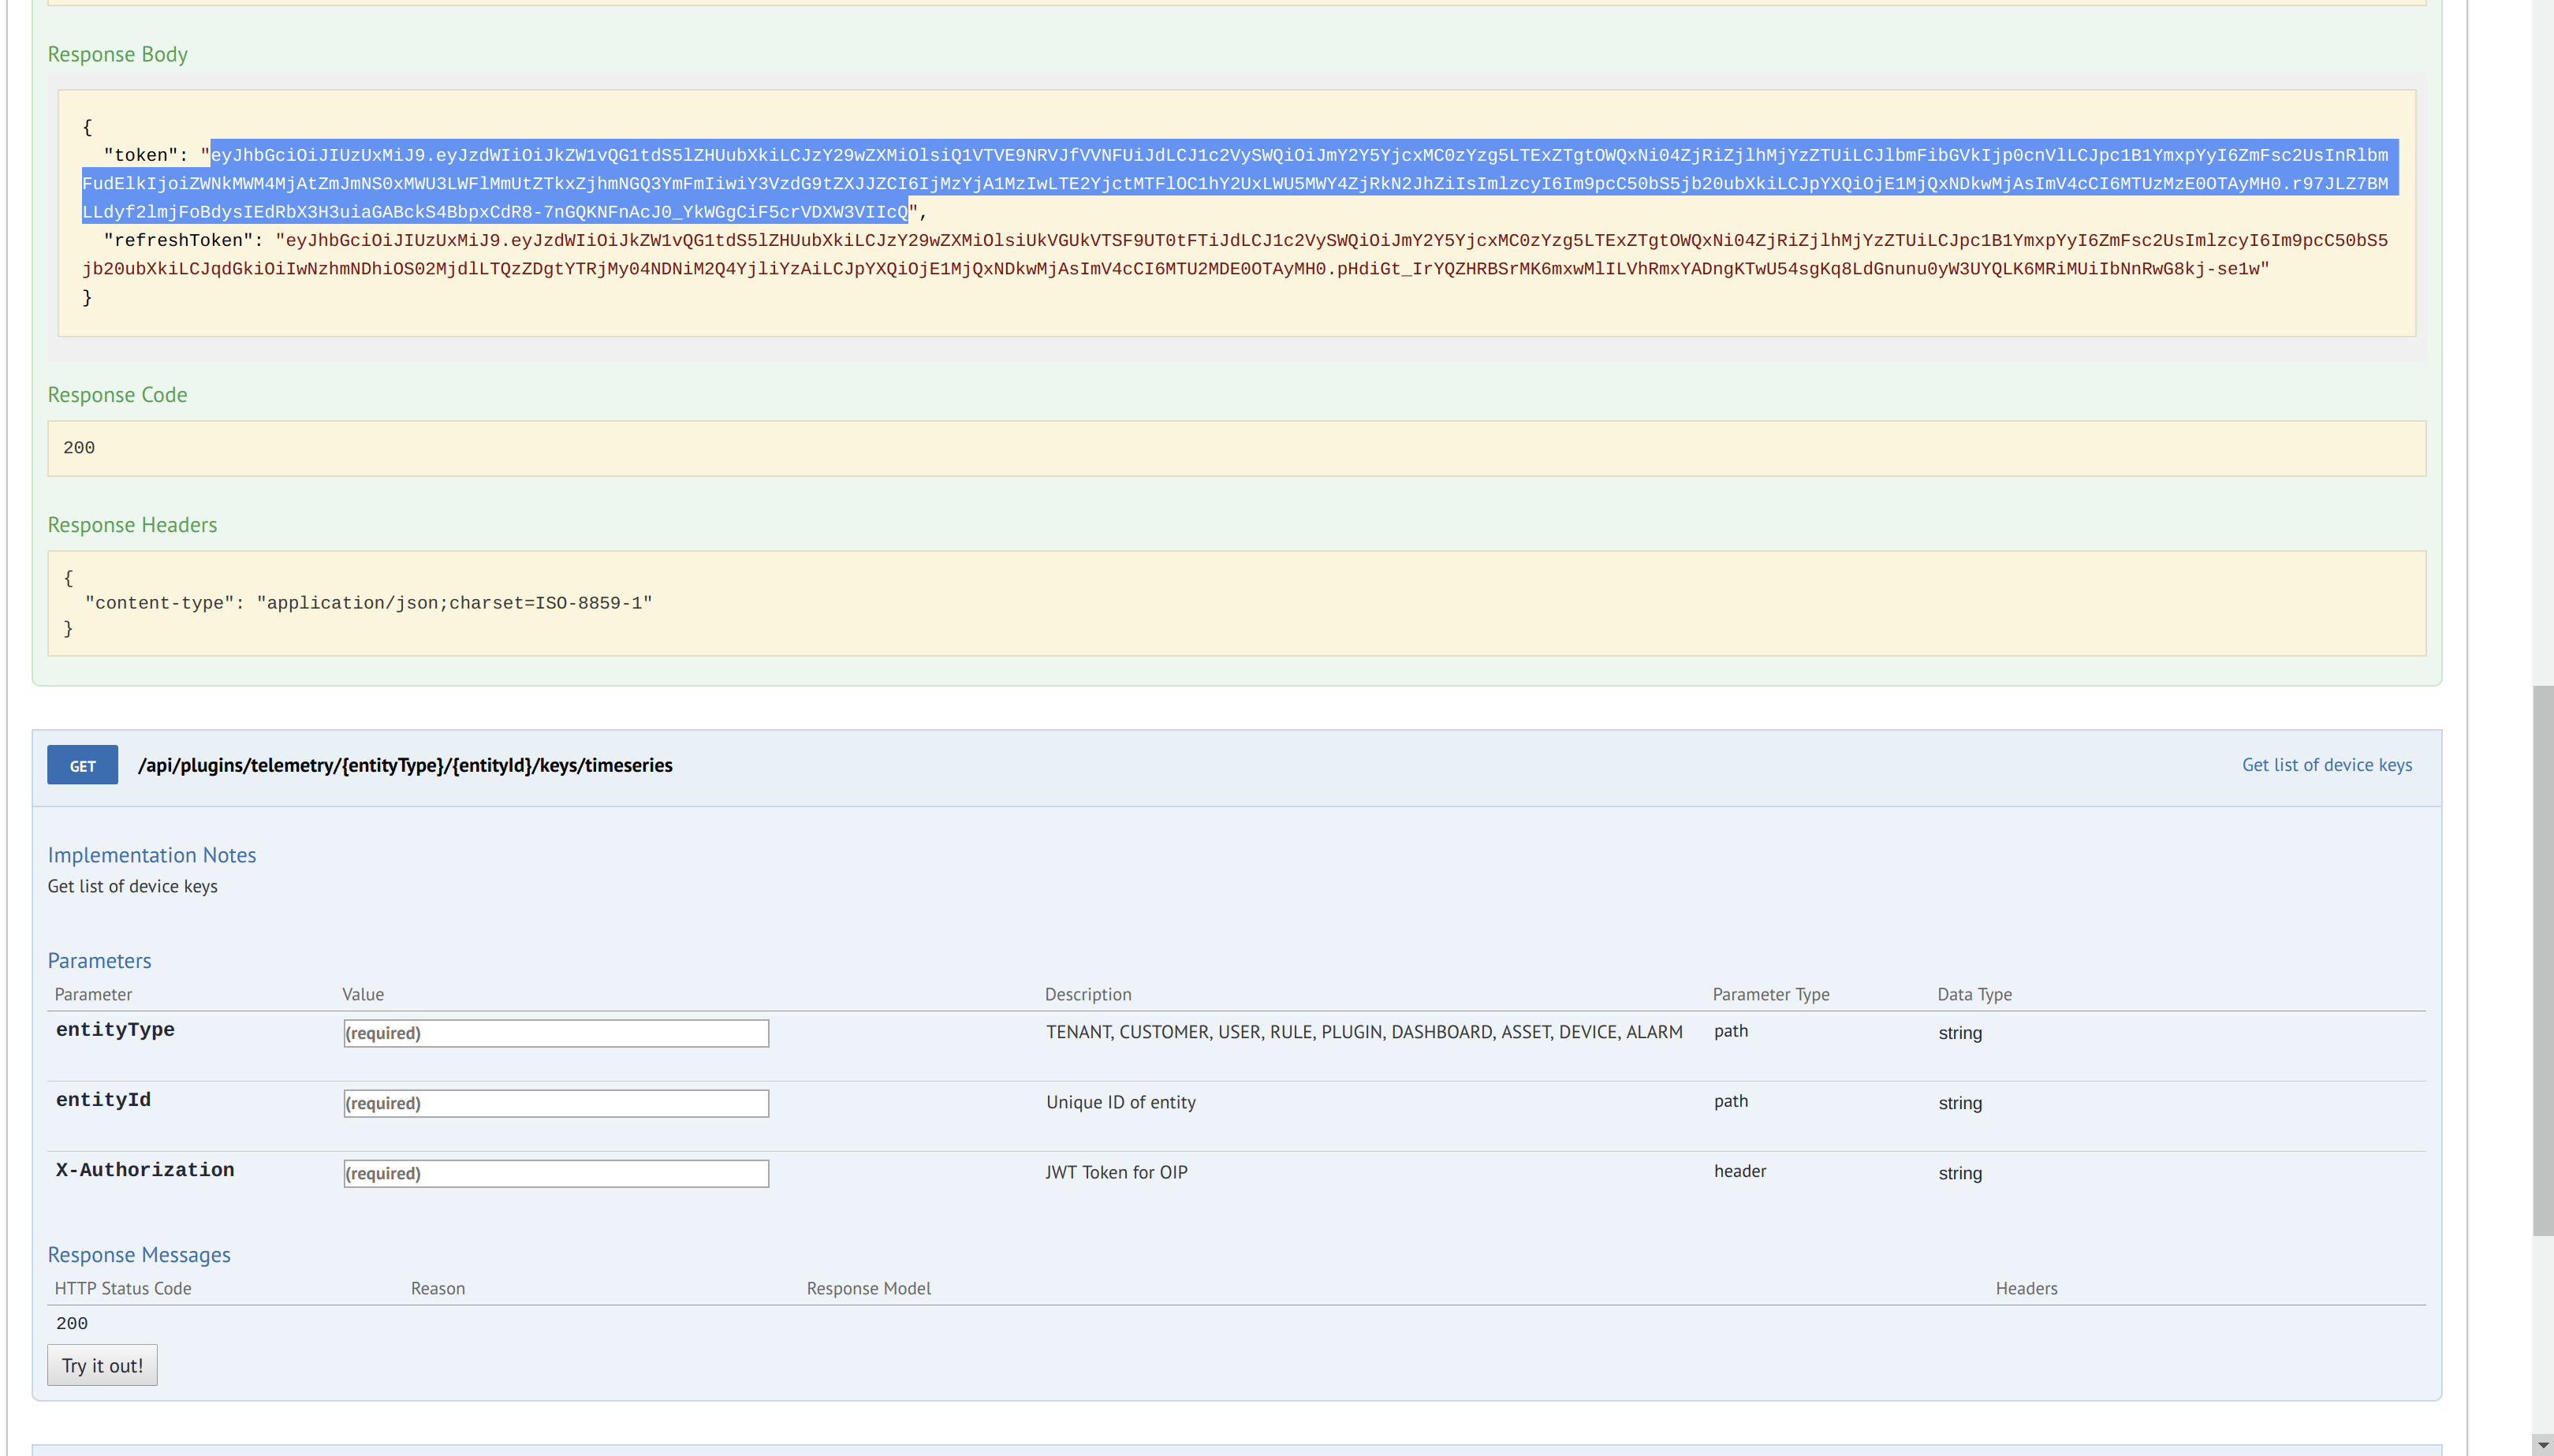
10. Enter all the information identified in the previous step as shown in the figure.
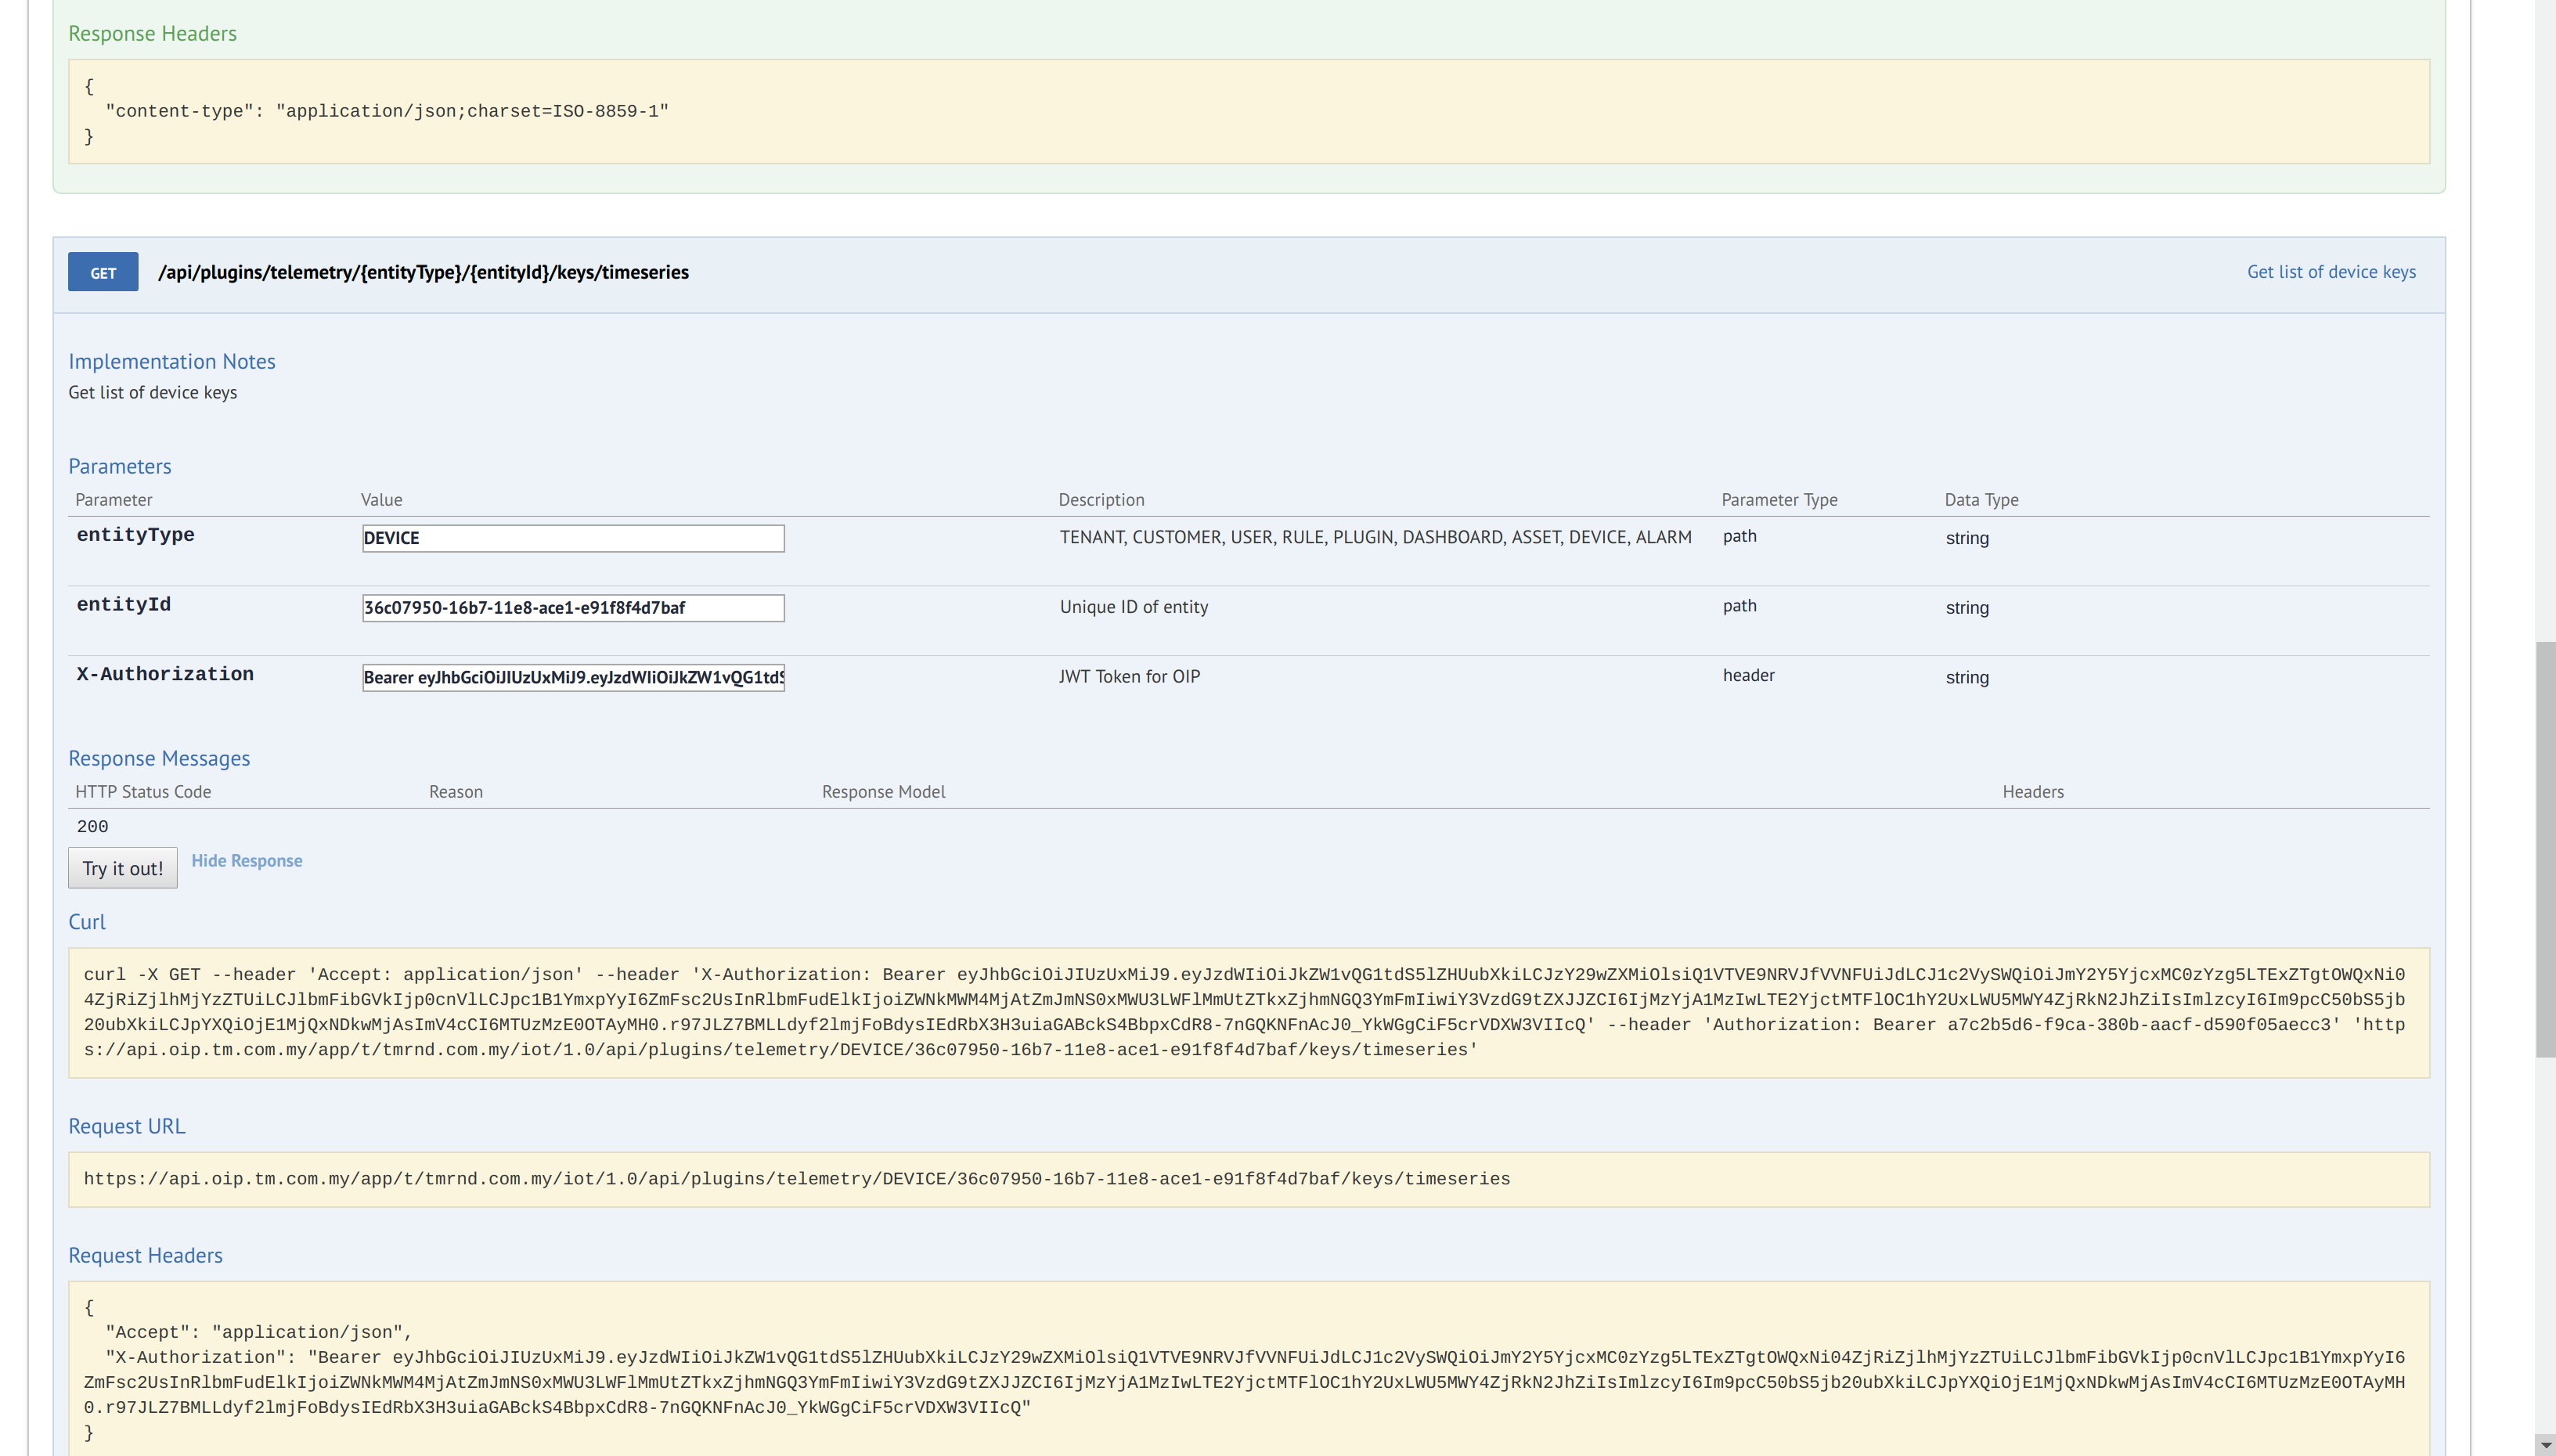
11. Click on try it out button and you will get all the keys of the timeseries data associated with particular entity.

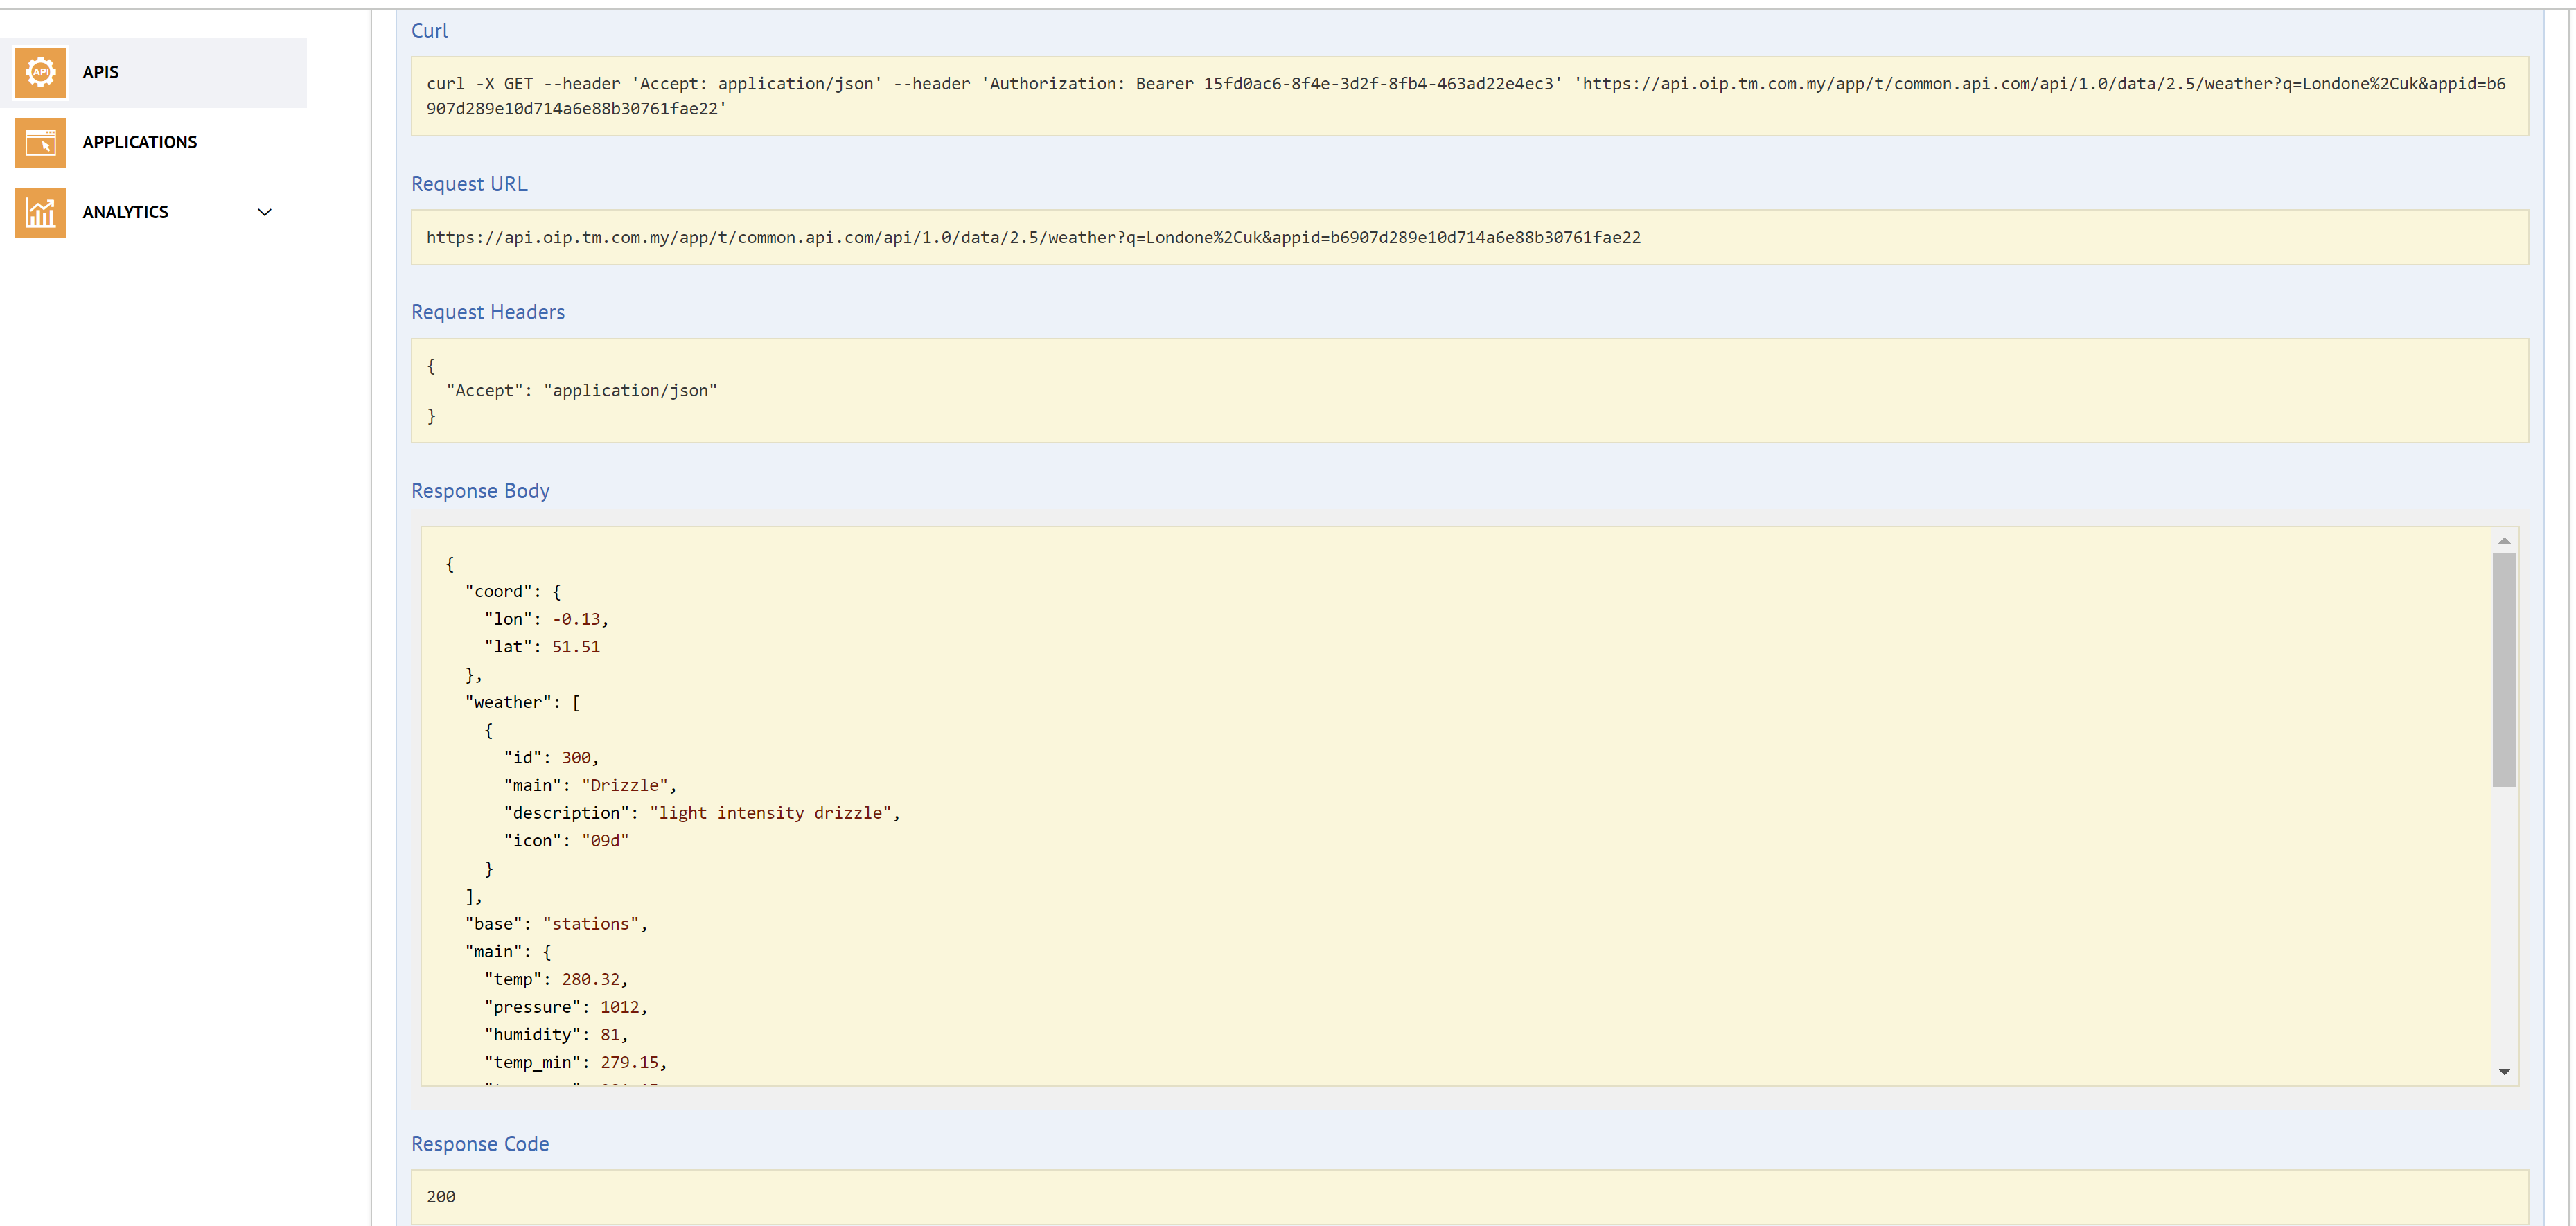
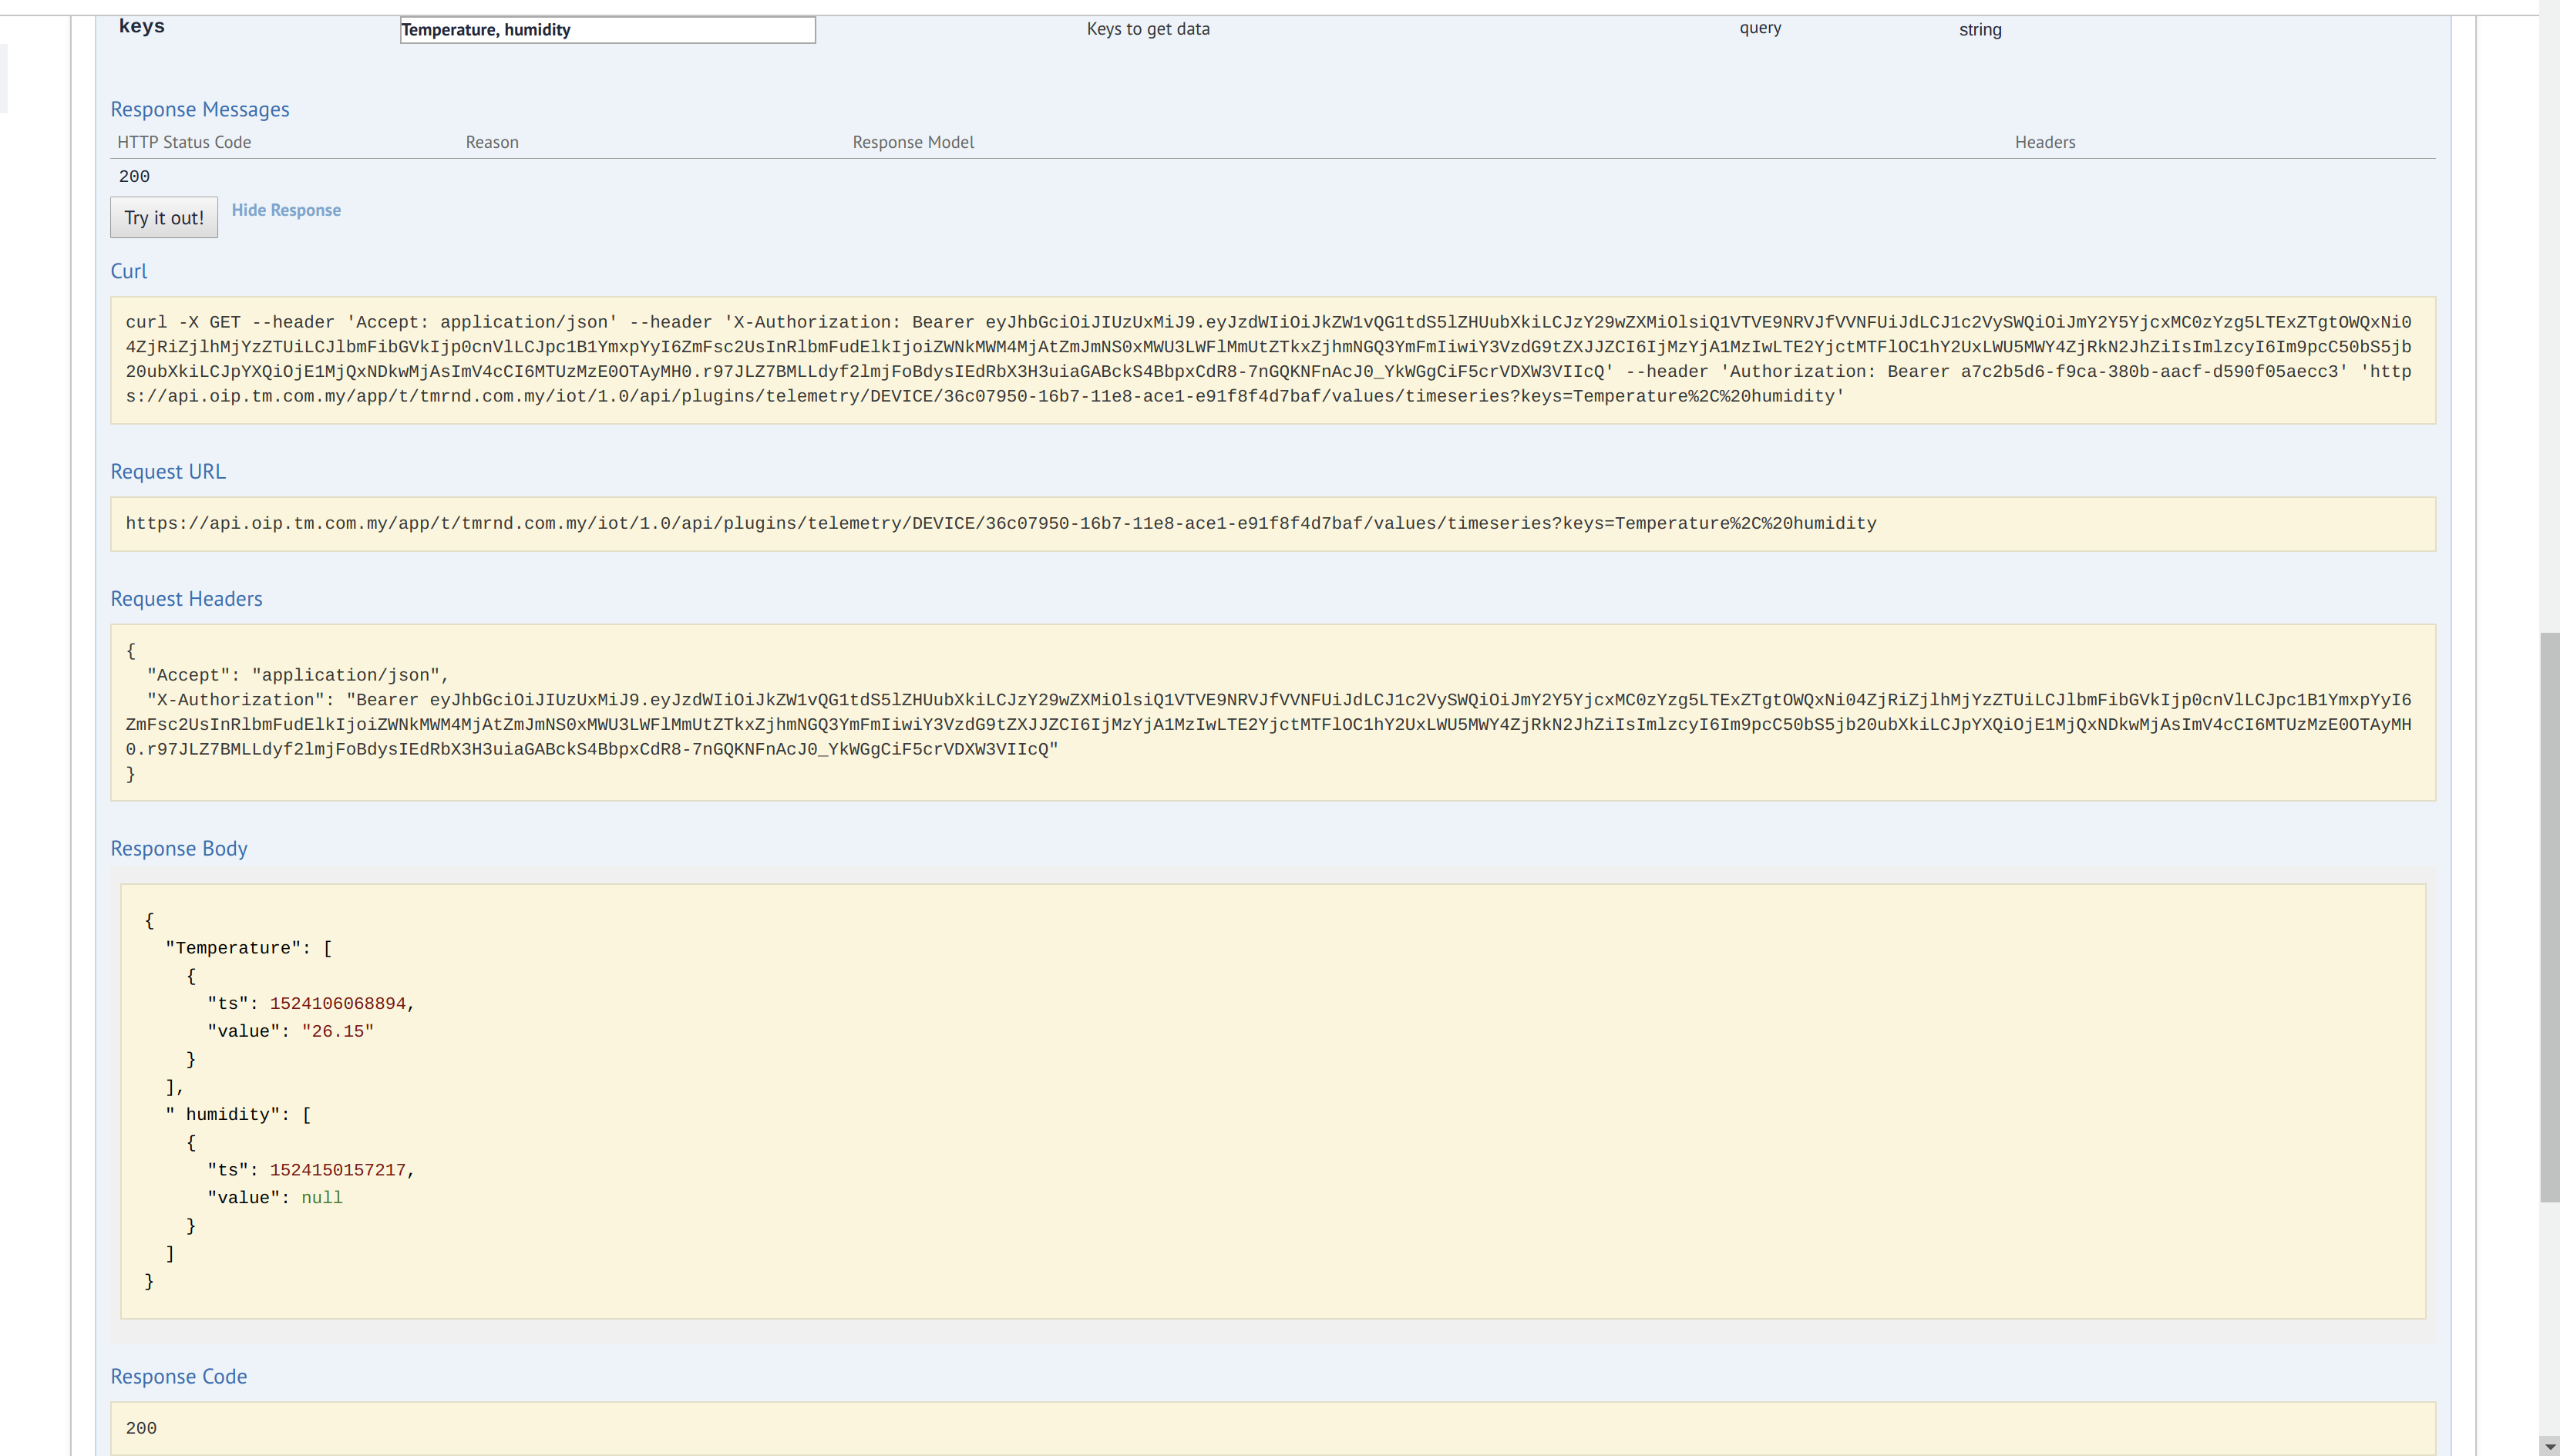
12. The following API provides the data based on the keys that are obtained in the previous step. Enter all the information in the box plus the keys you want the data. For example we want data on Temperature and humidity so will enter in the key box Temperature,humidity as shown in figure below.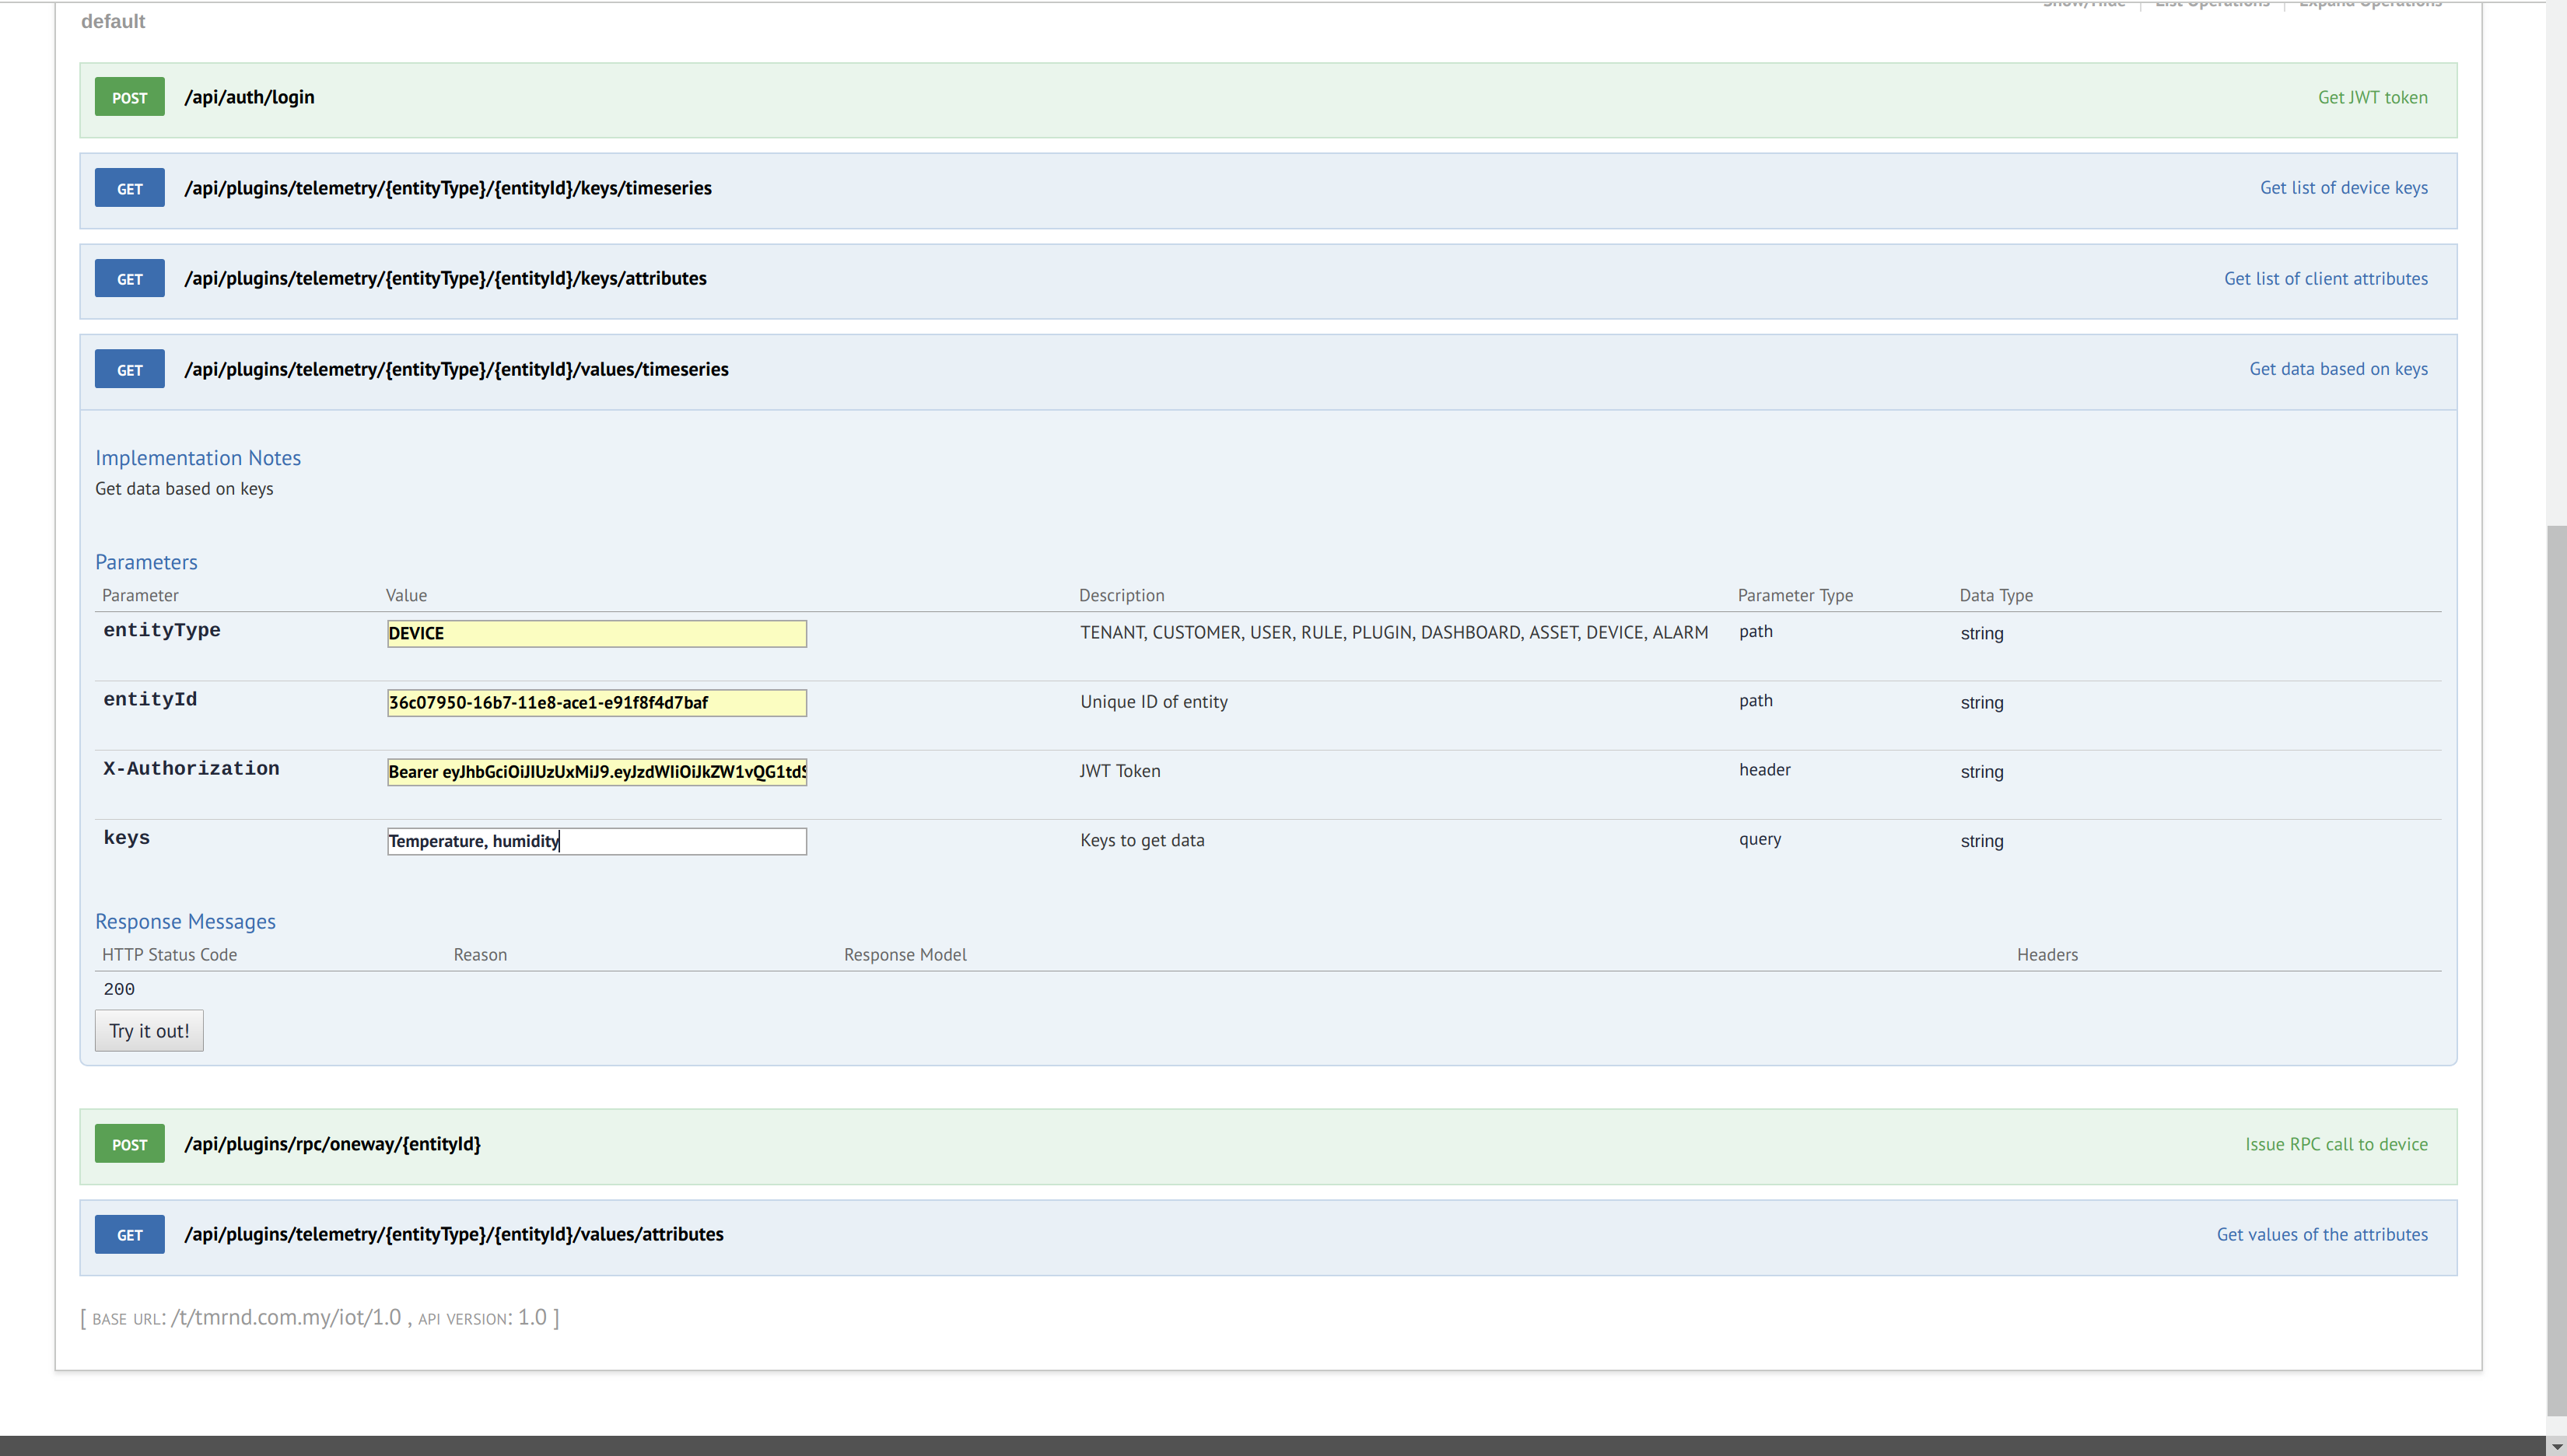
13. On clicking try it out button we will get the data of the keys we have entered.
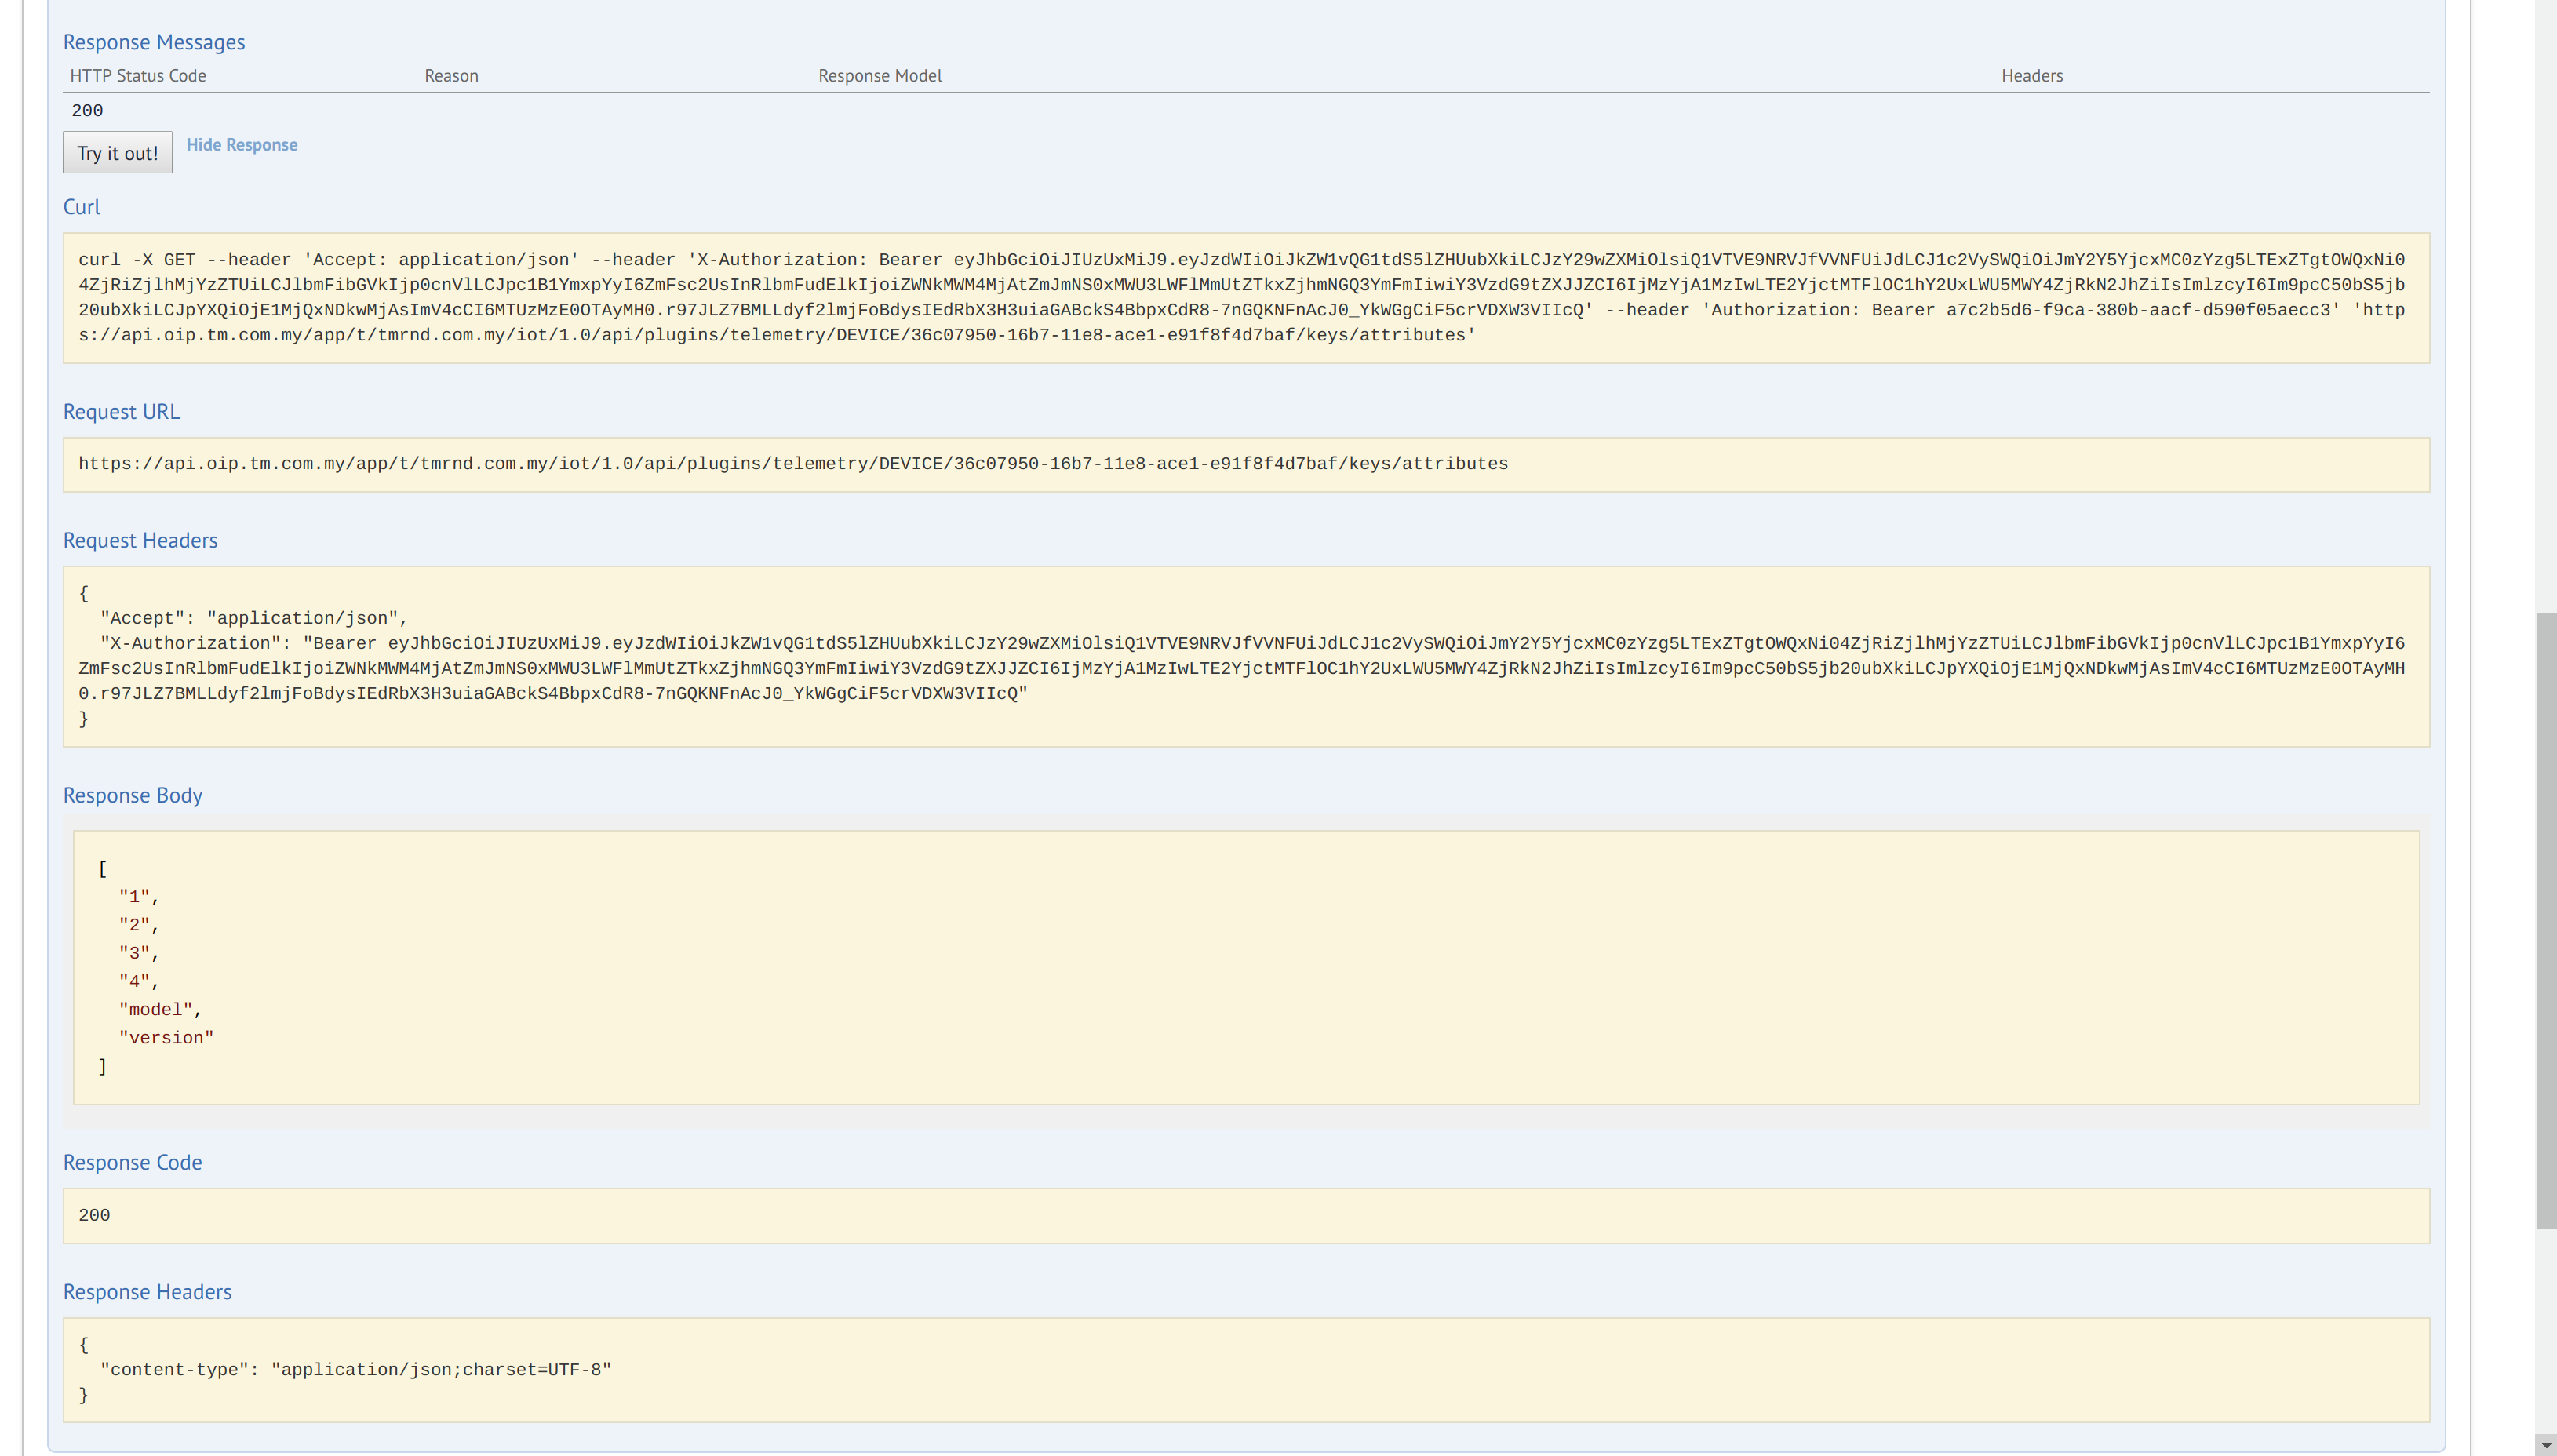
14. The following API gives the attributes keys associated with particular device. Enter all the information in the box as shown.
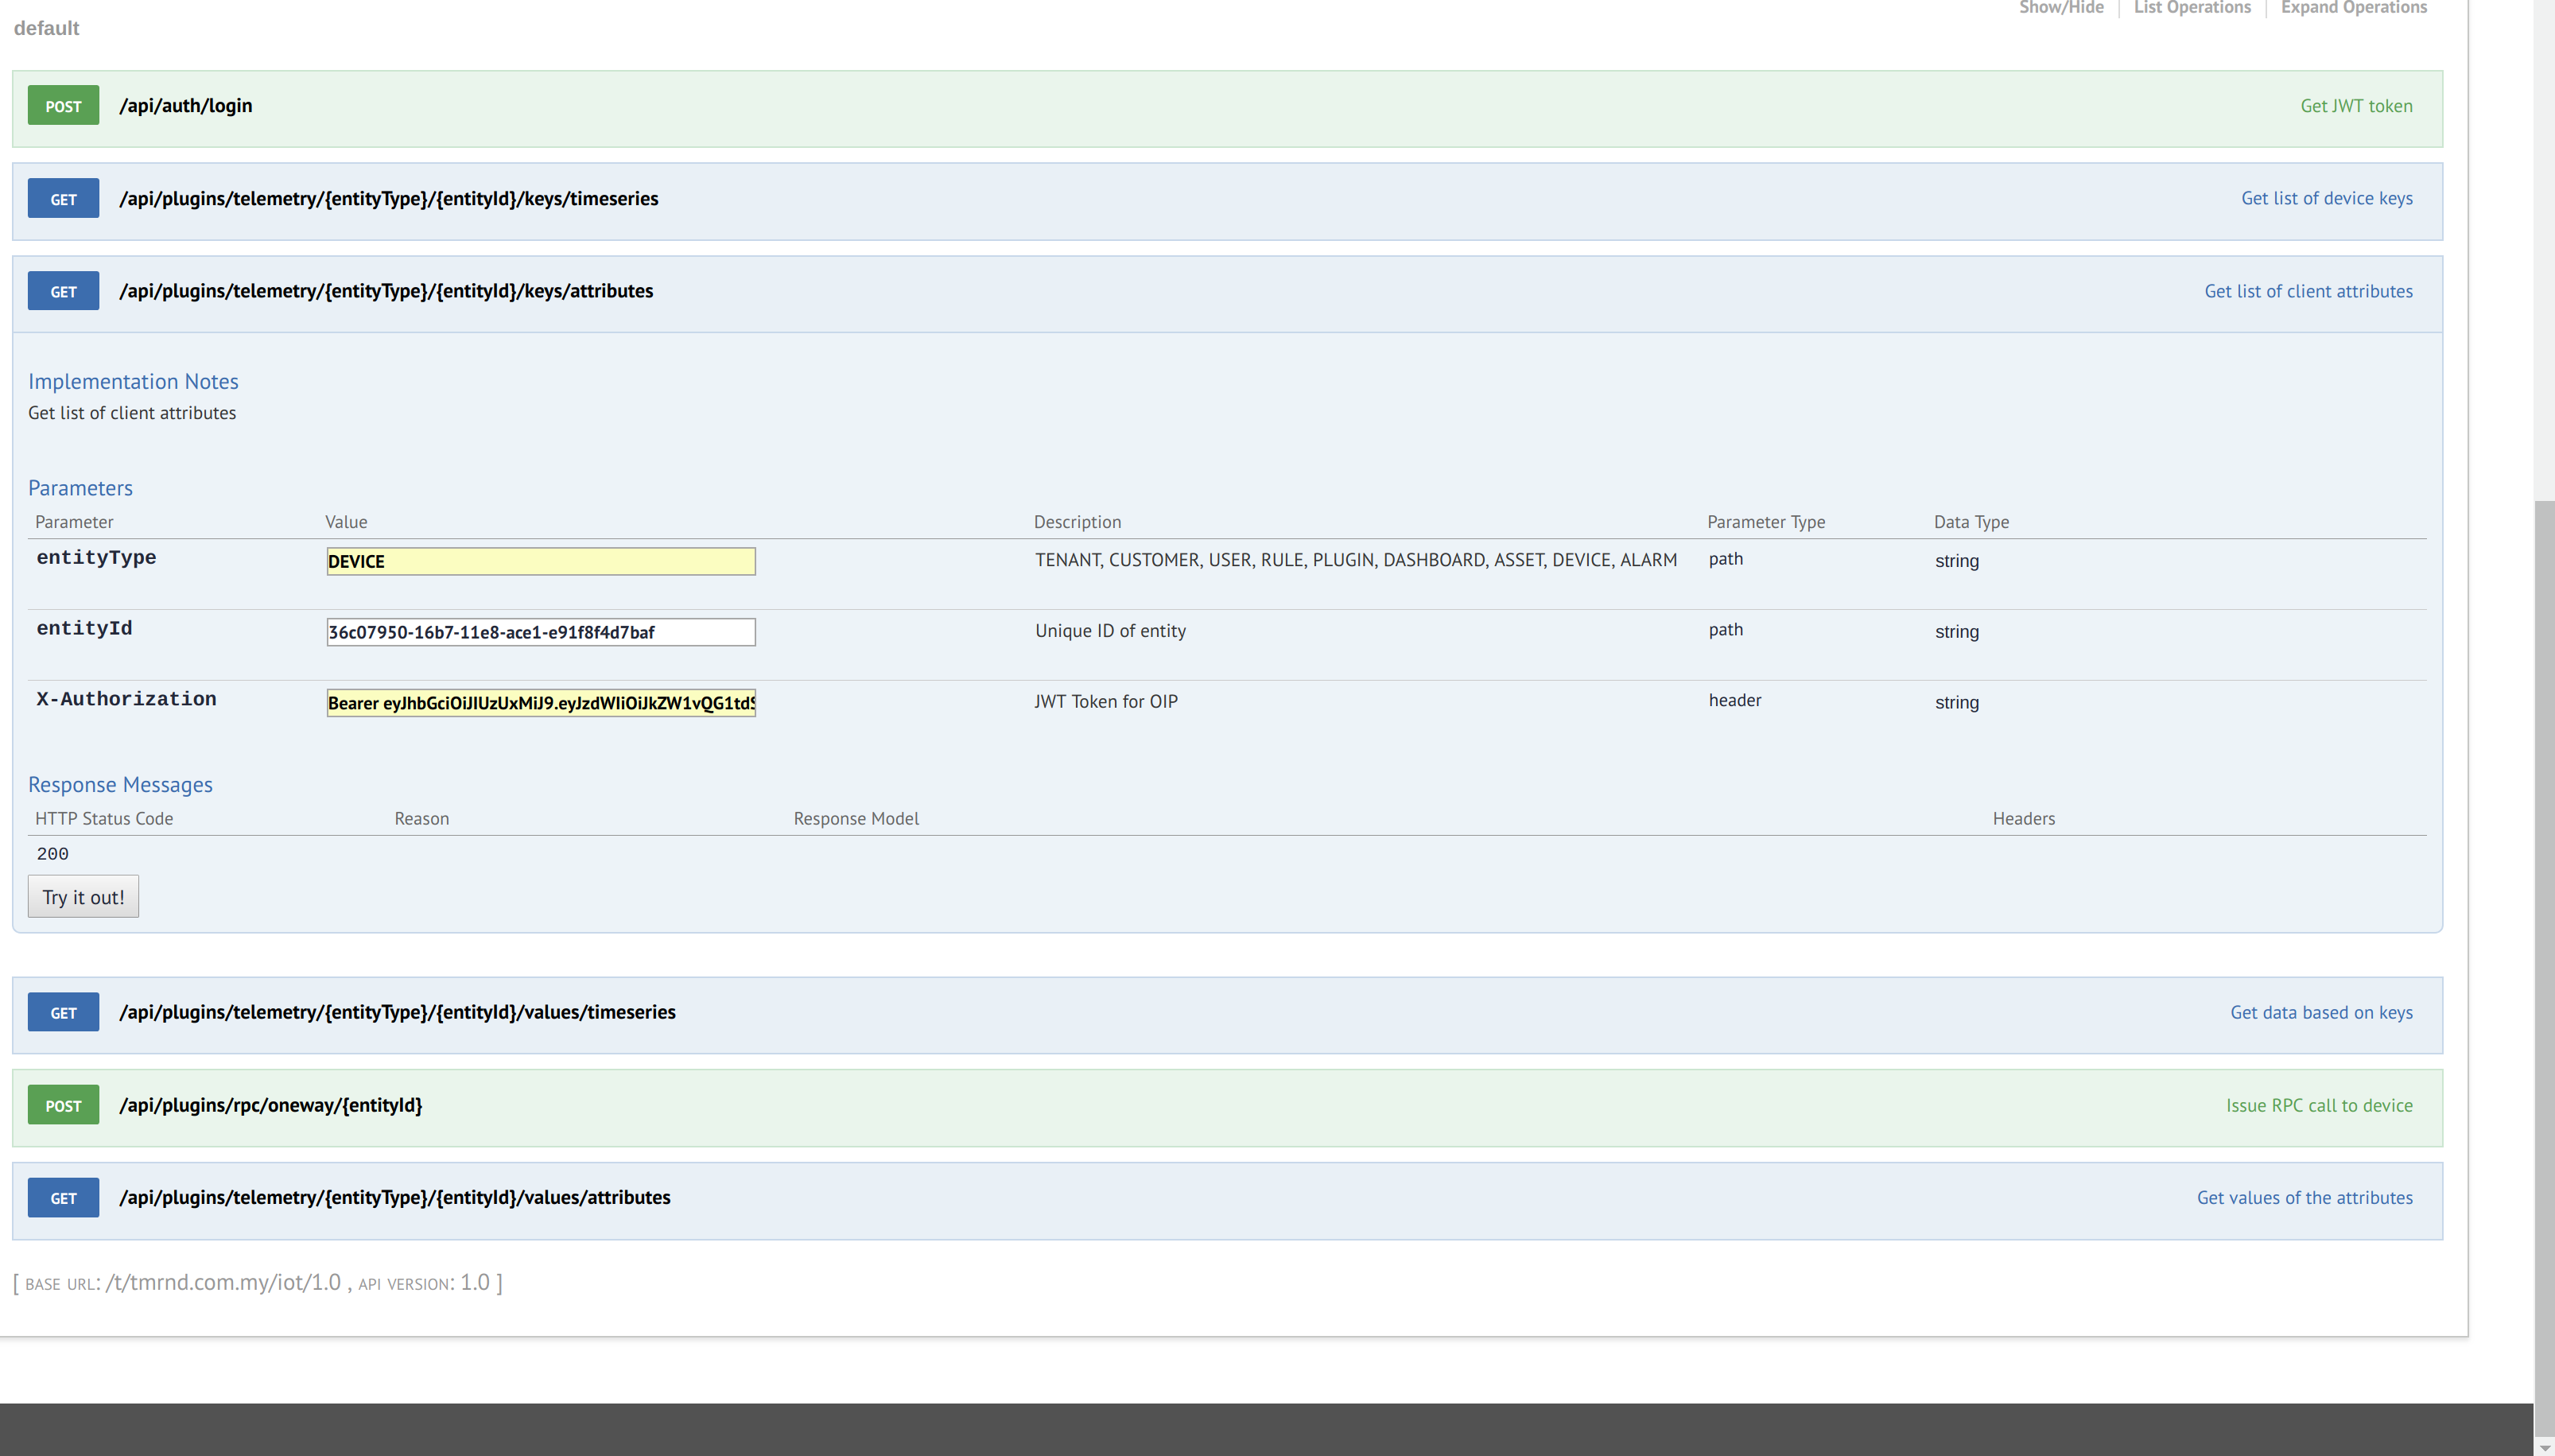
15. You will get the keys associated with the device attributes when you hit the try it out button.
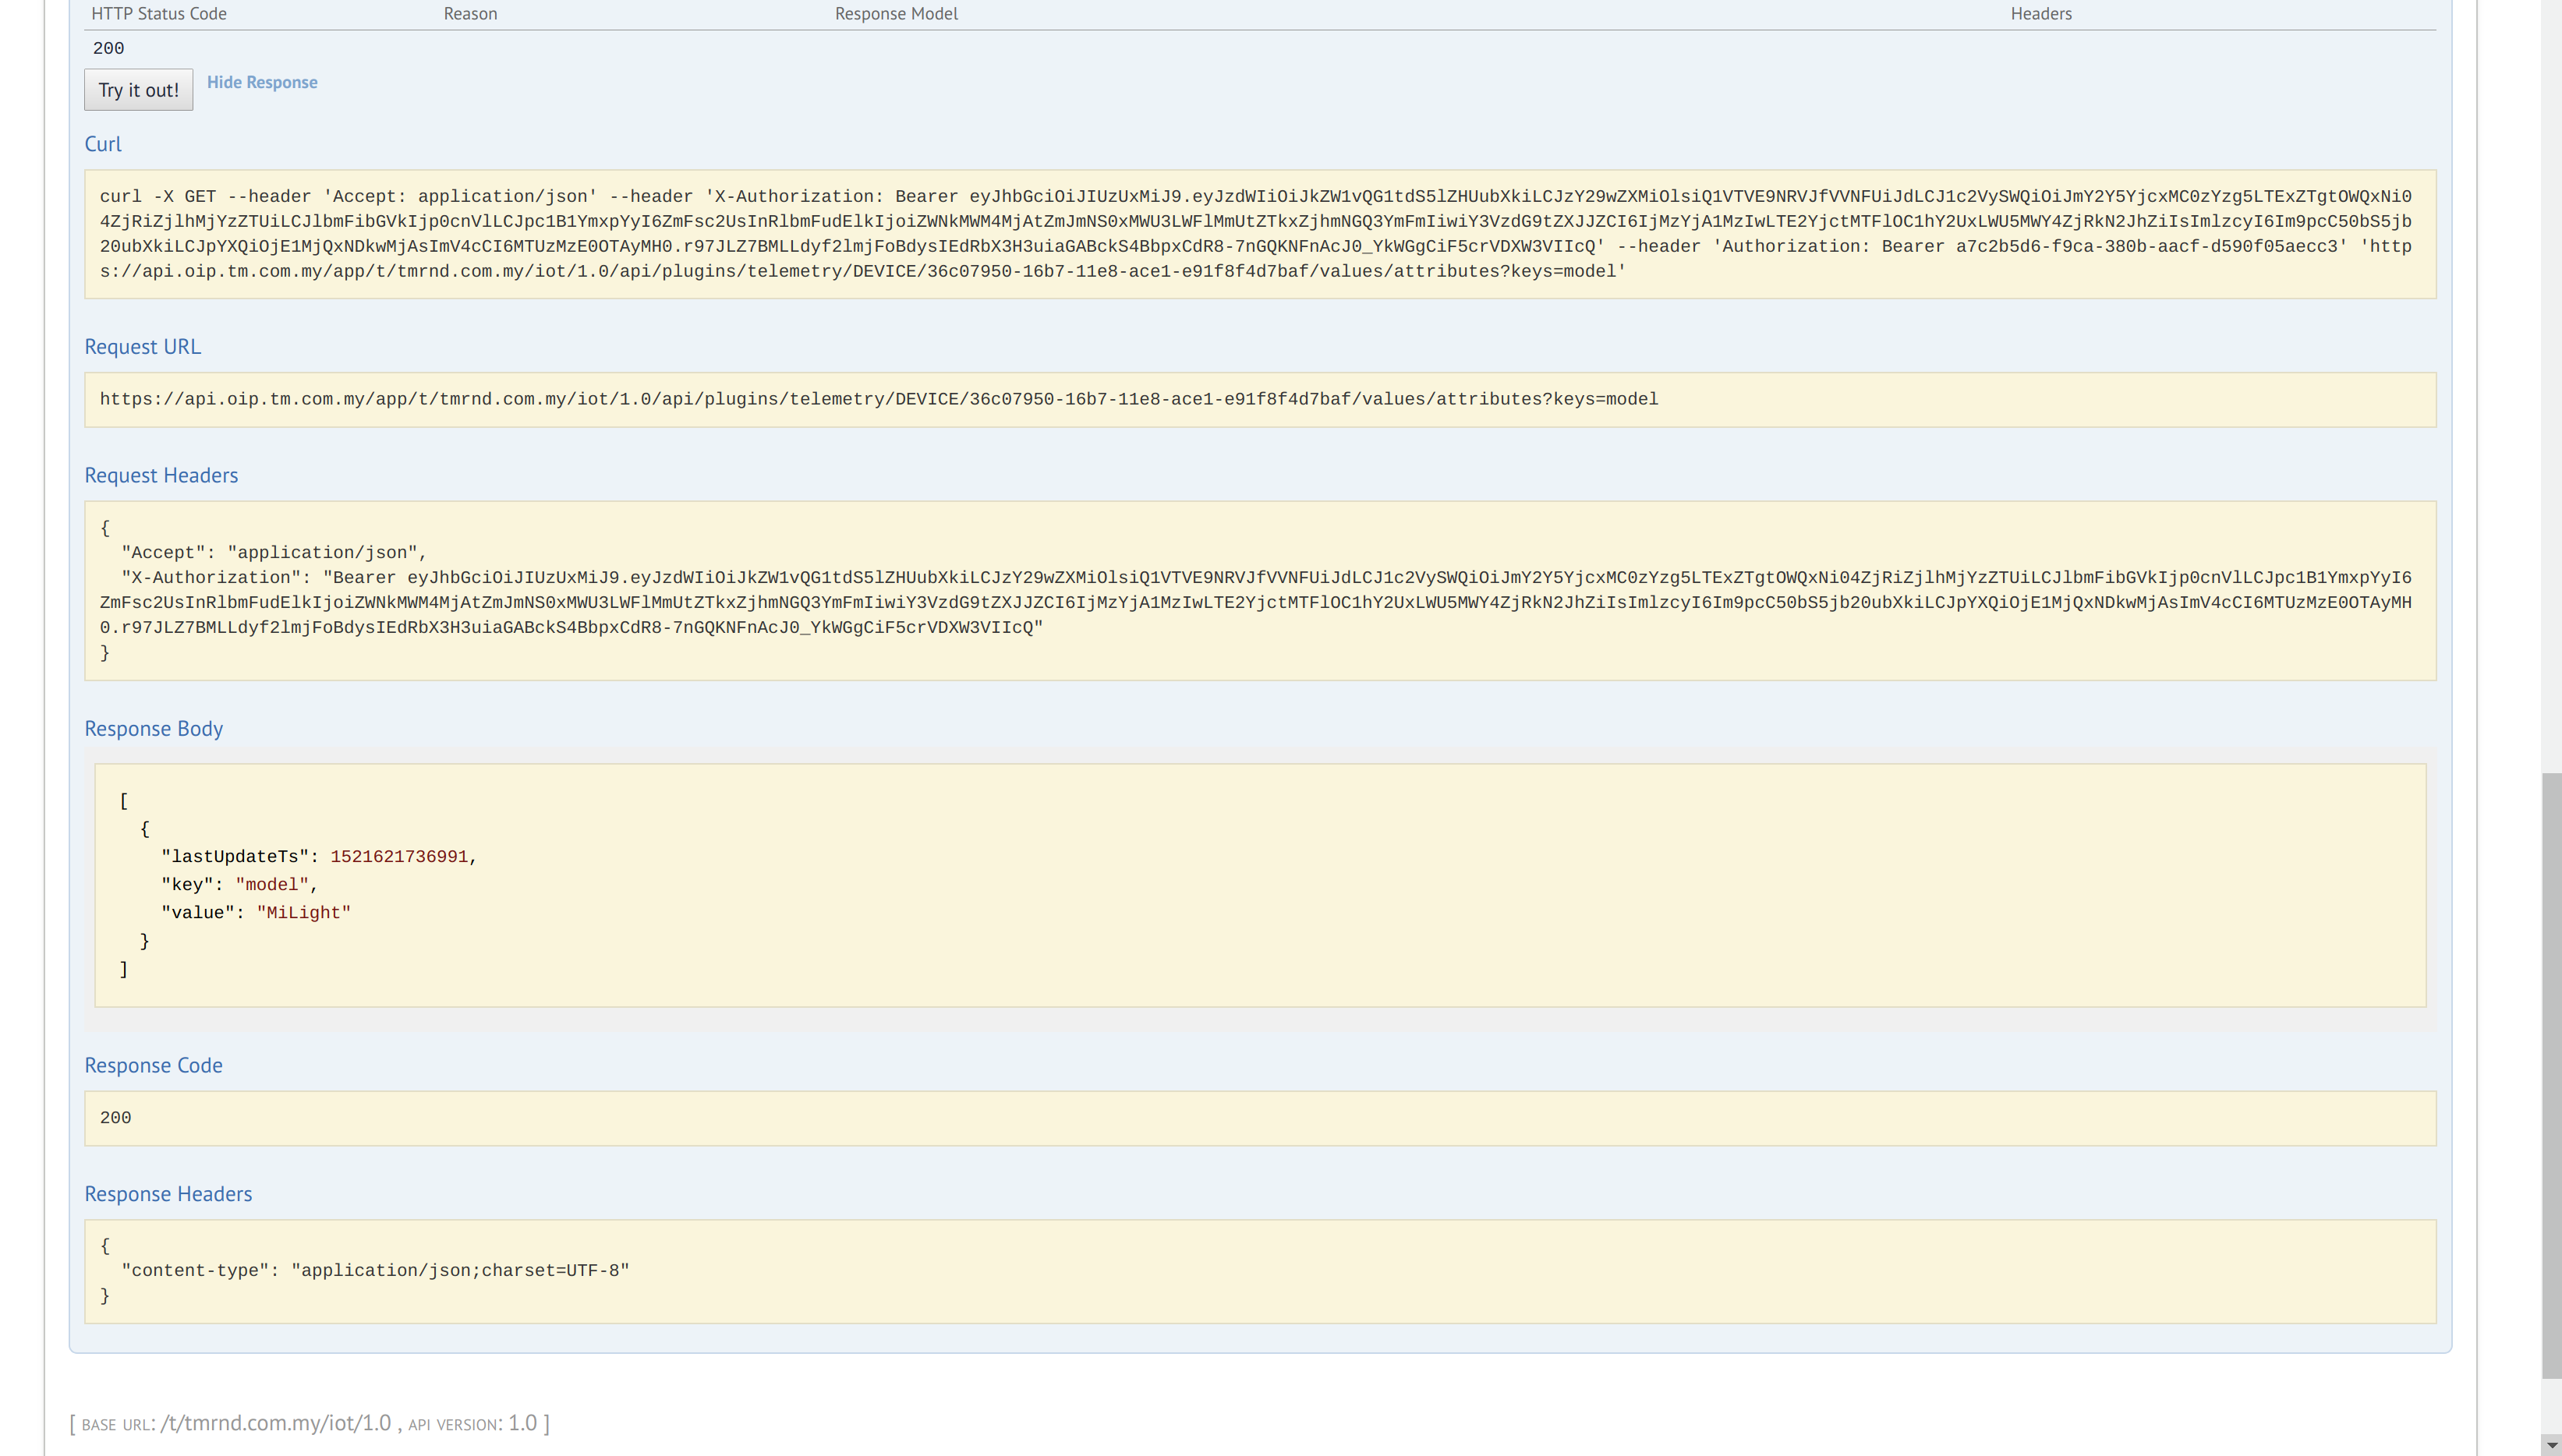
16. After you have the attribute key you can get the attribute value by choosing the key just as you did for time series data. For example we want attribute data identified by key named "model". So we enter the "model" in the key box.
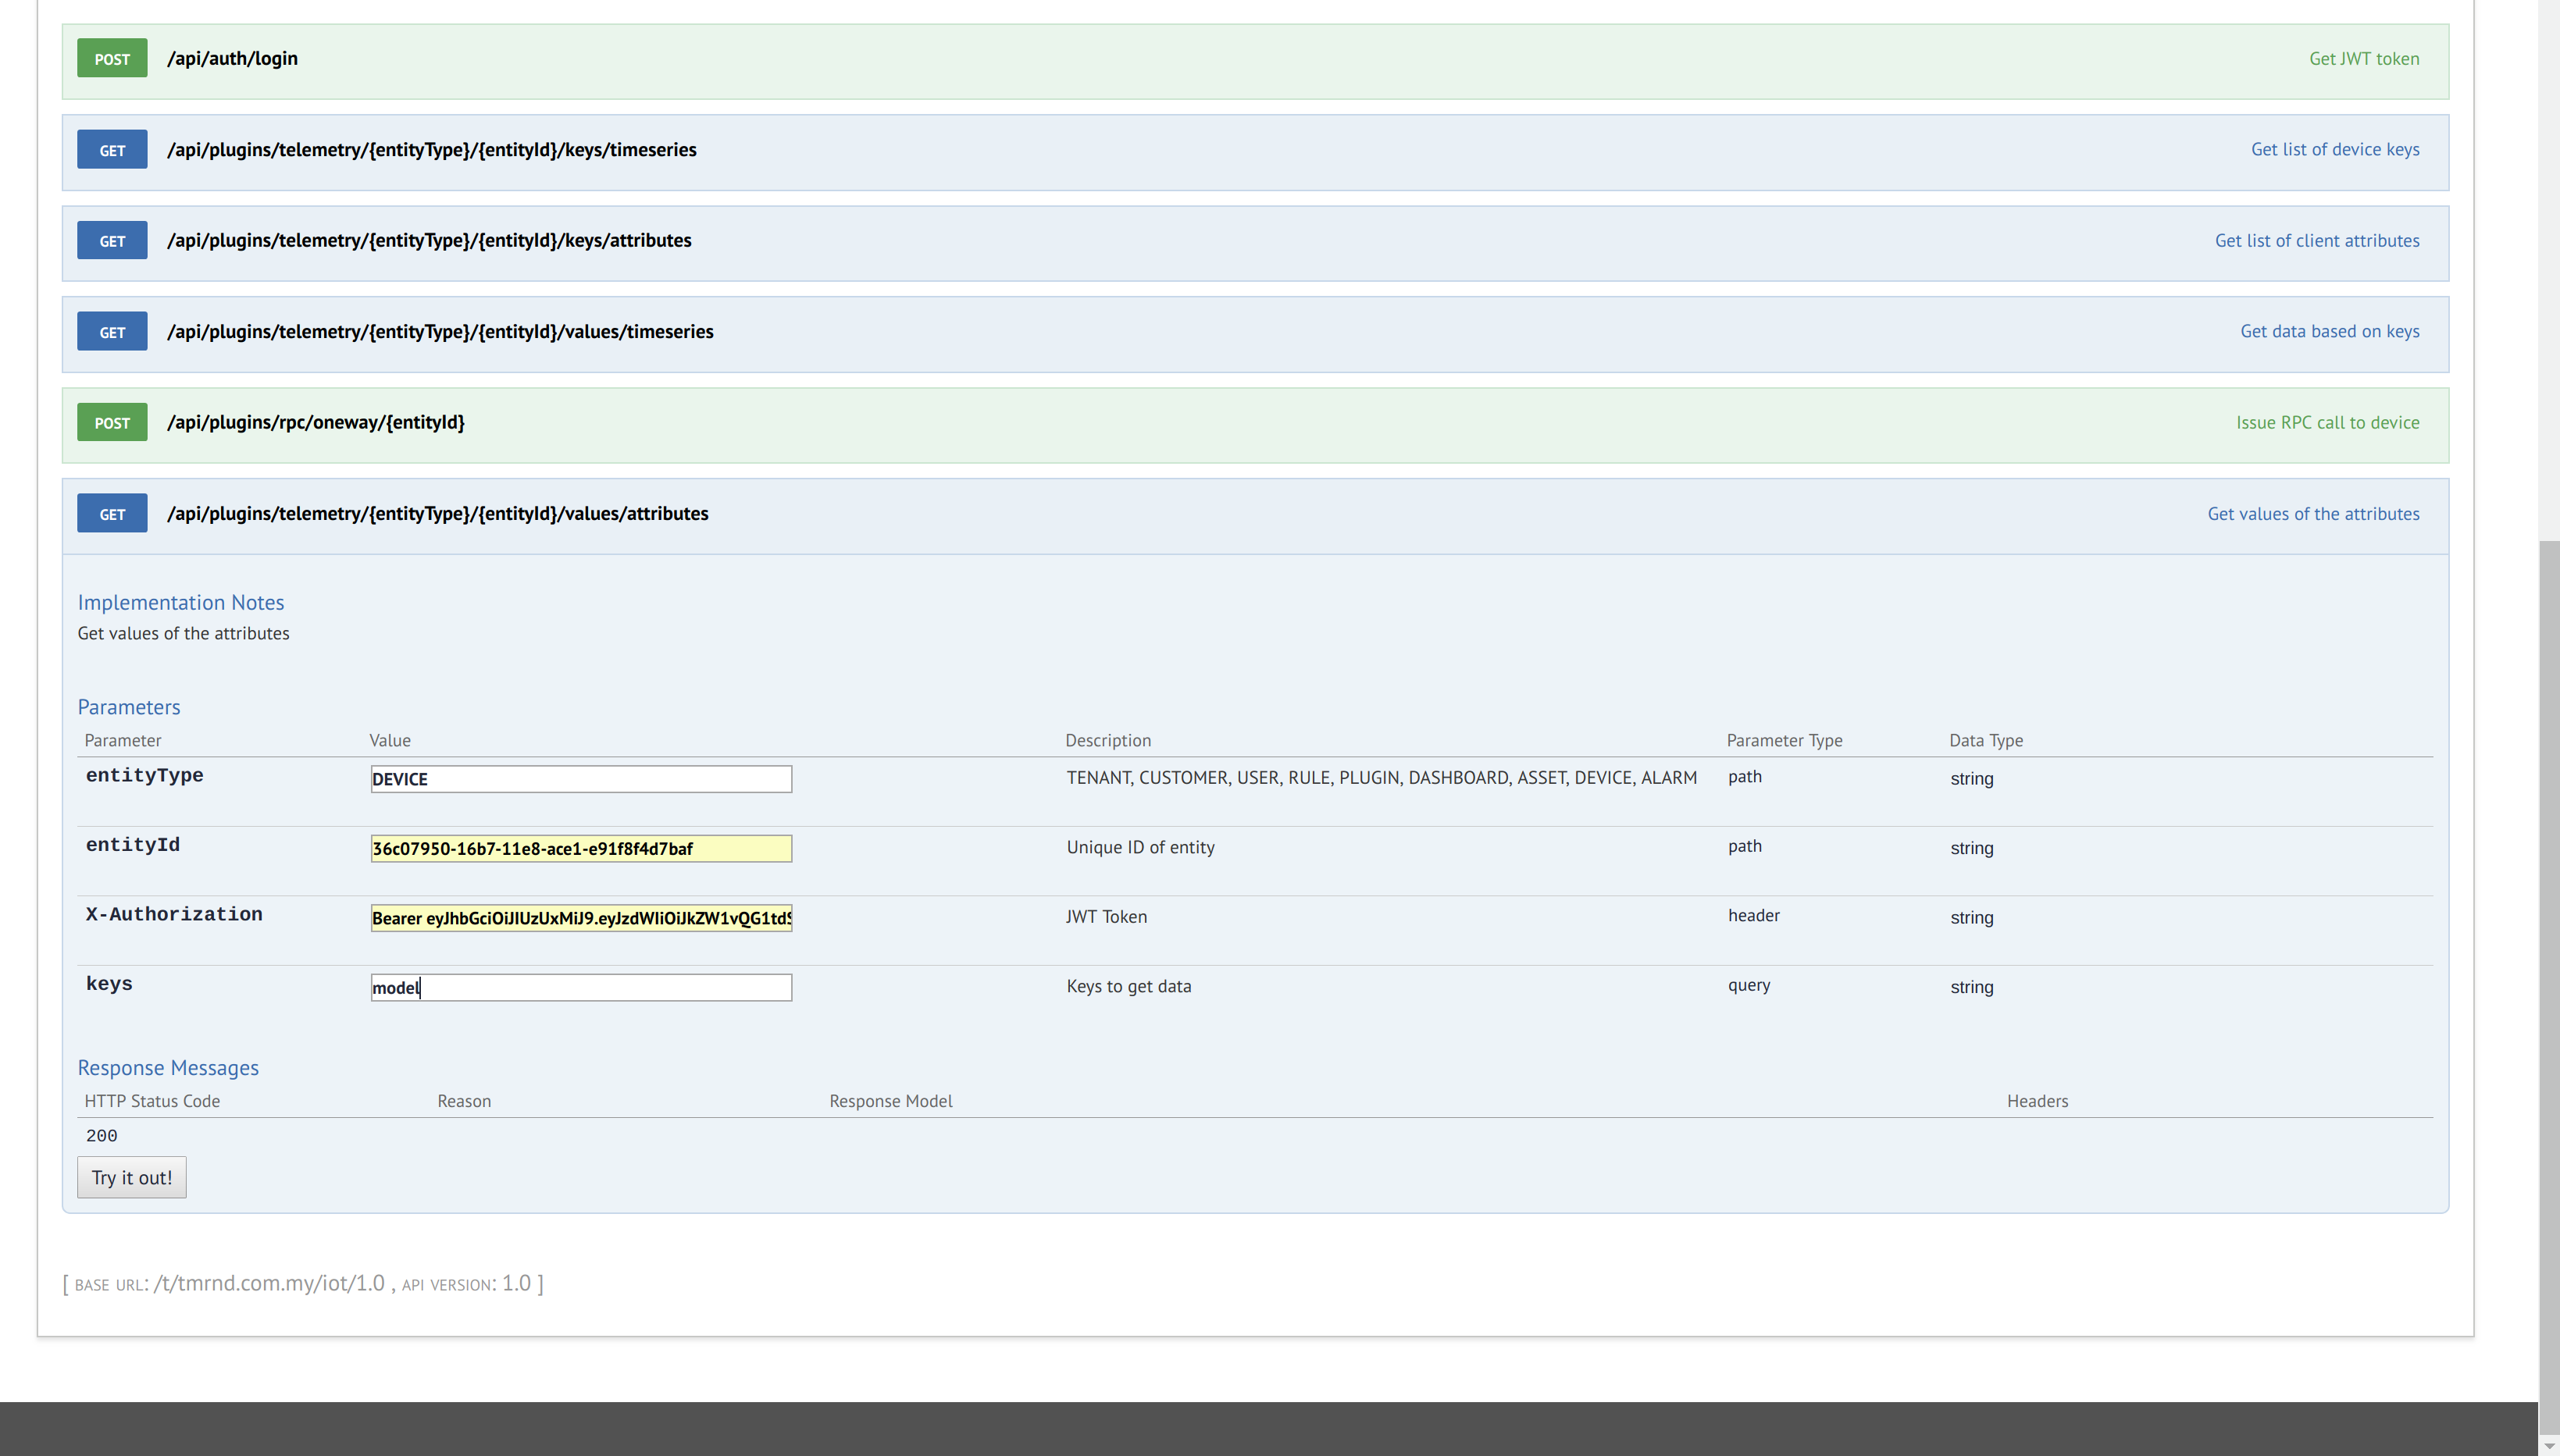
17. When you hit try it out you will receive the data.
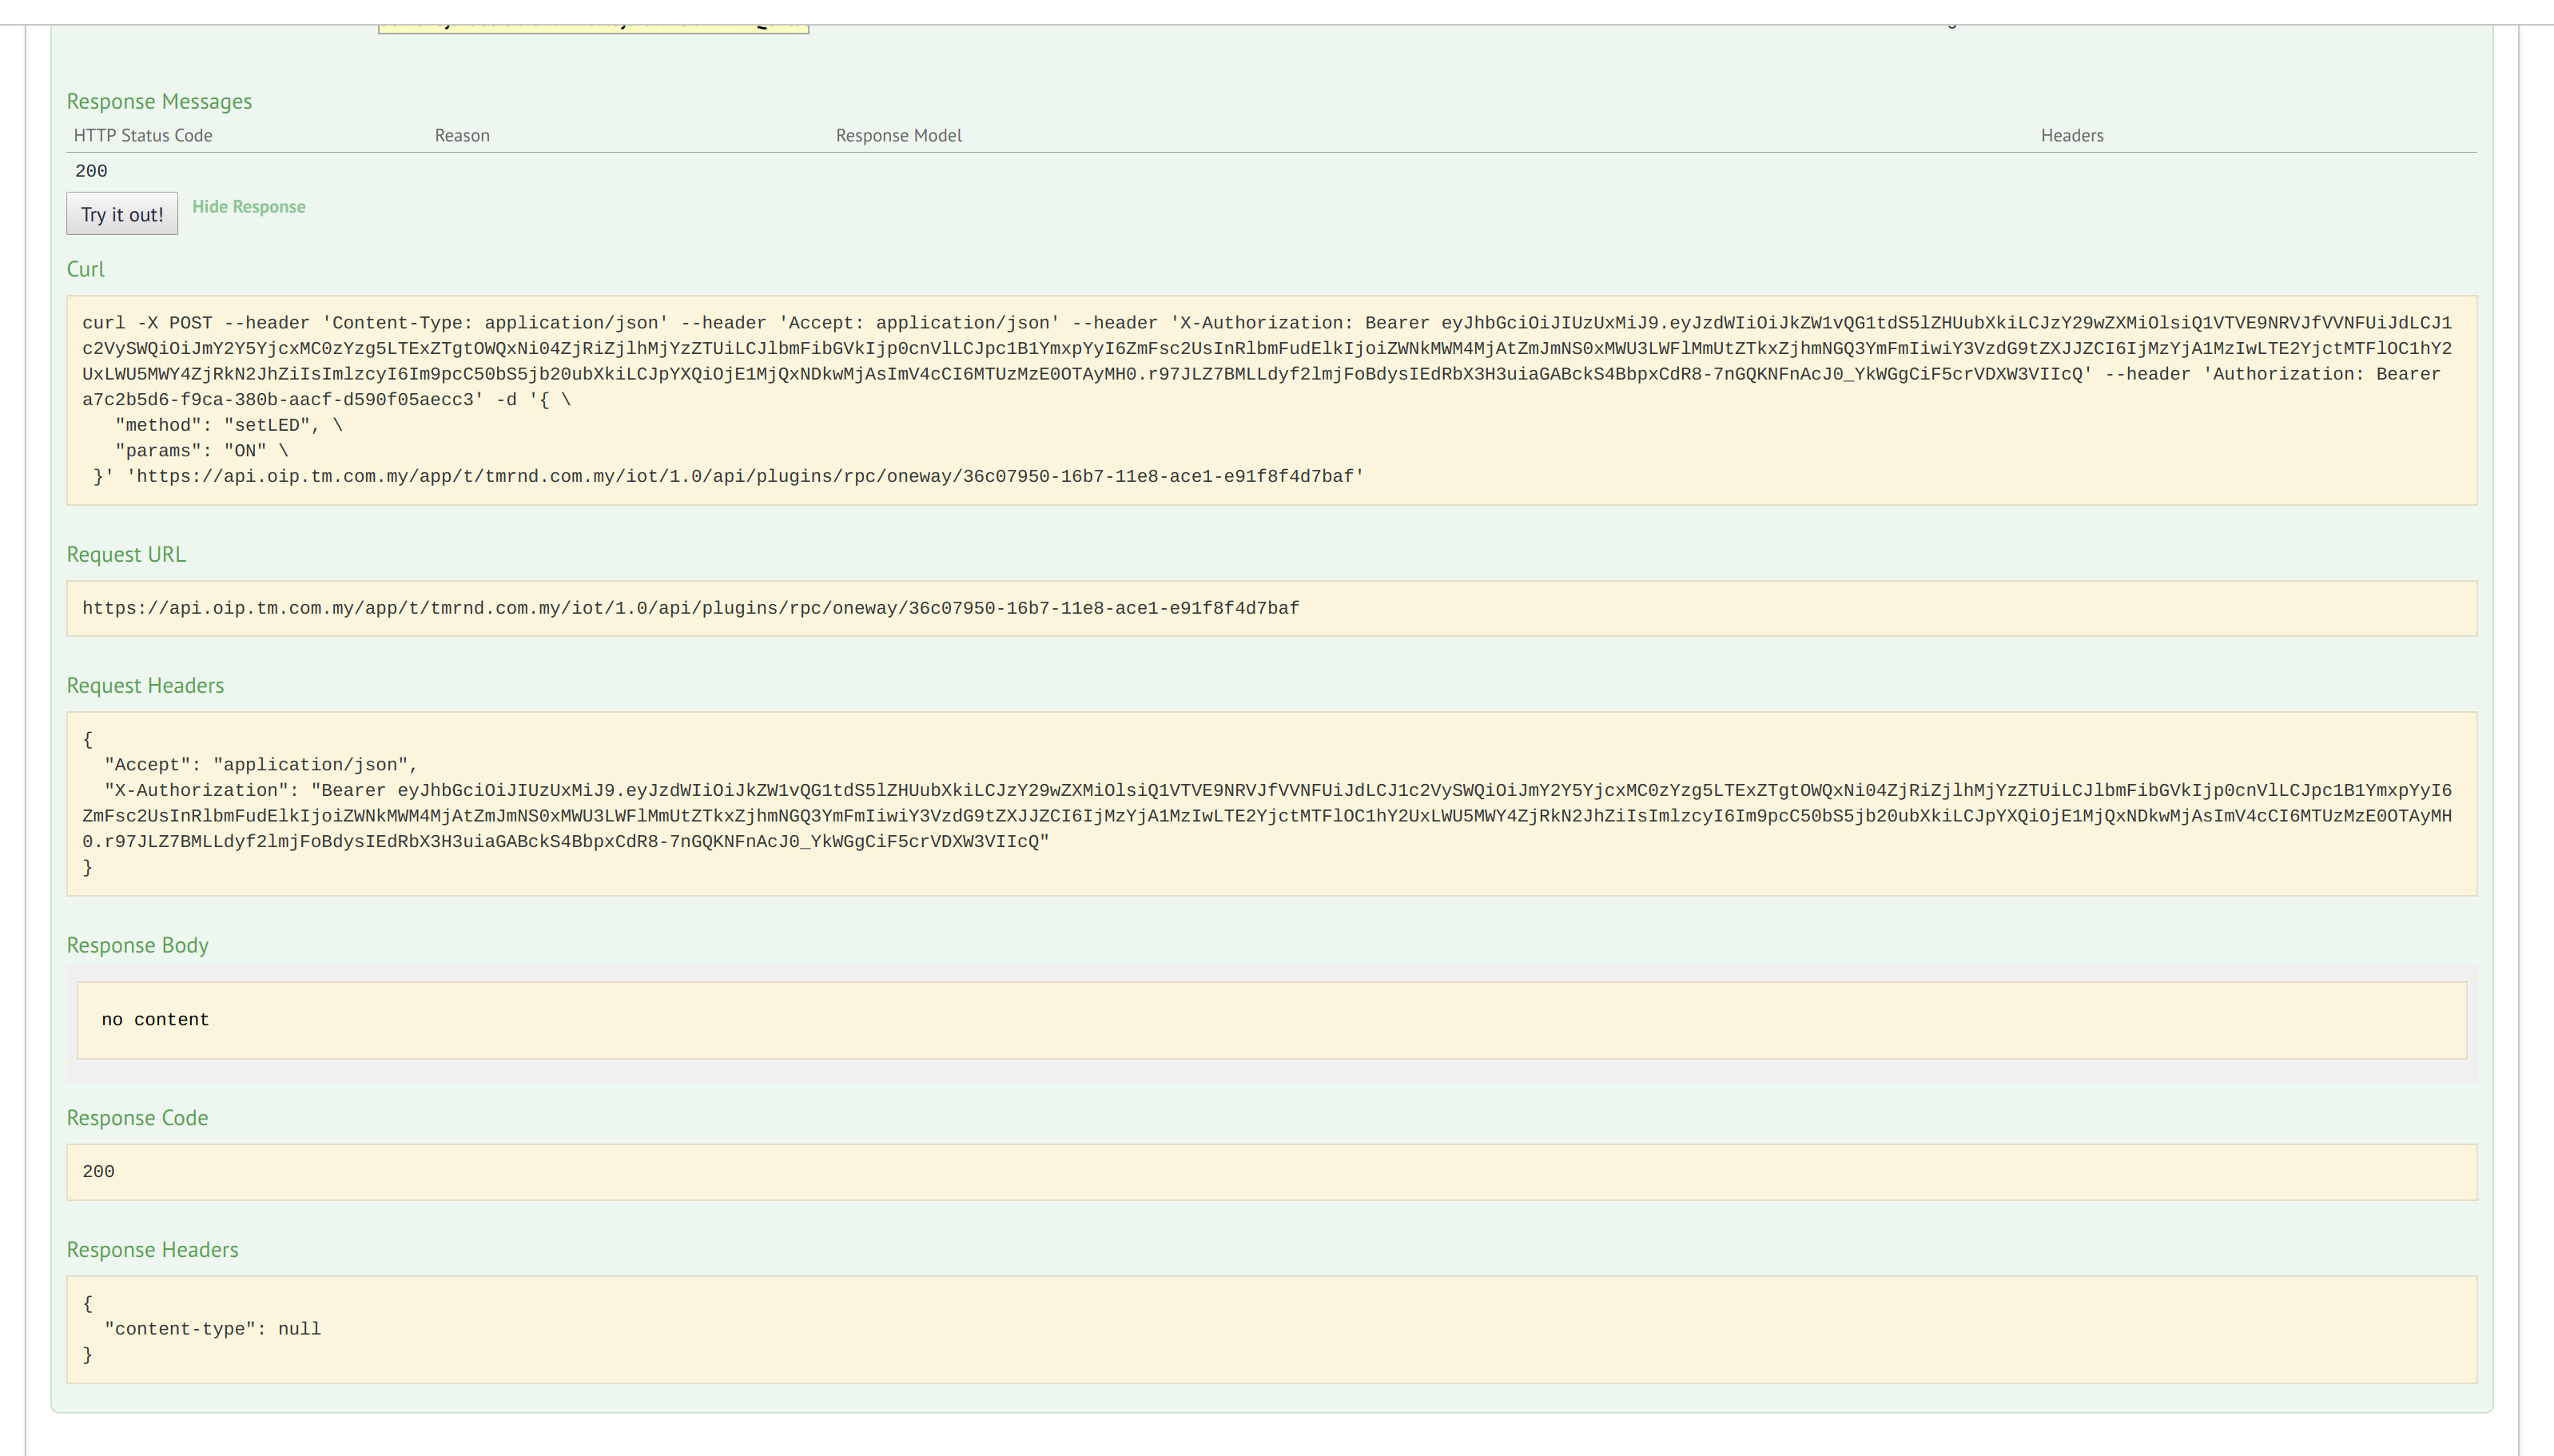
18. Issue a control command via Remote Procedure Call (RPC) to your device. Your device is required to subscribe to the topic "v1/devices/me/rpc/request/+" to receive the command.
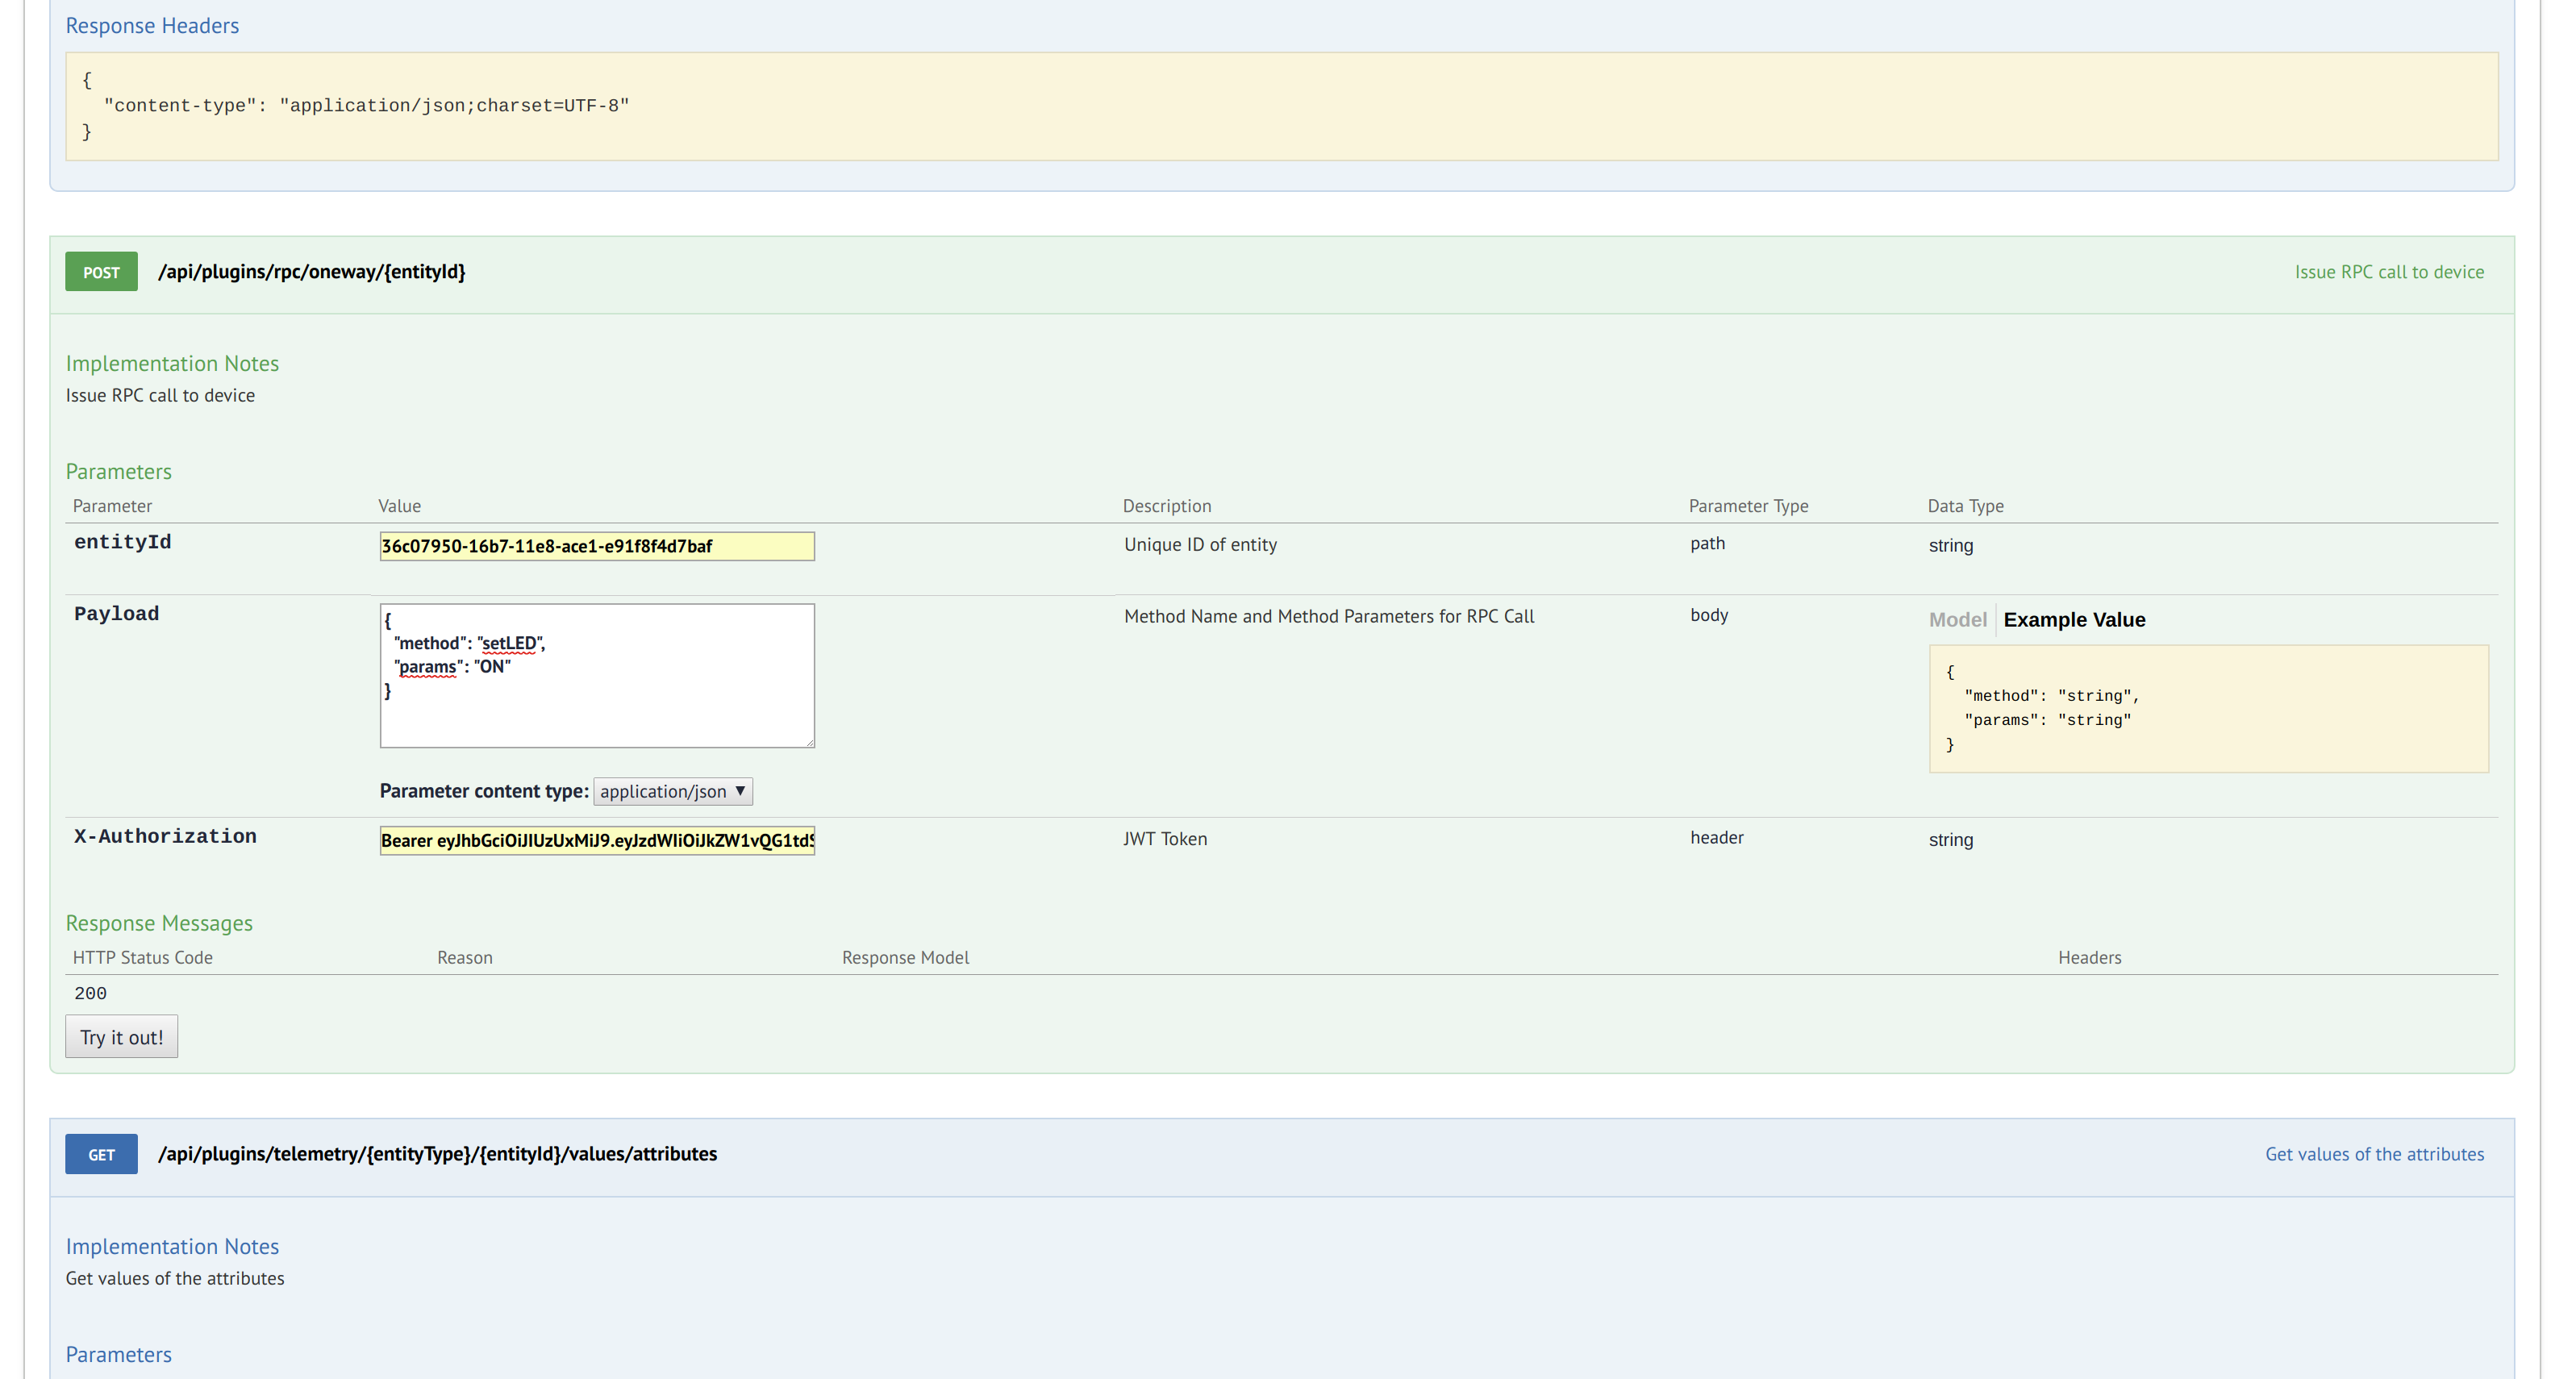
19. Response code should be 200 indicating that the command is successfully sent to the Service Creation Platform. Your device should receive the command then.
 !
!
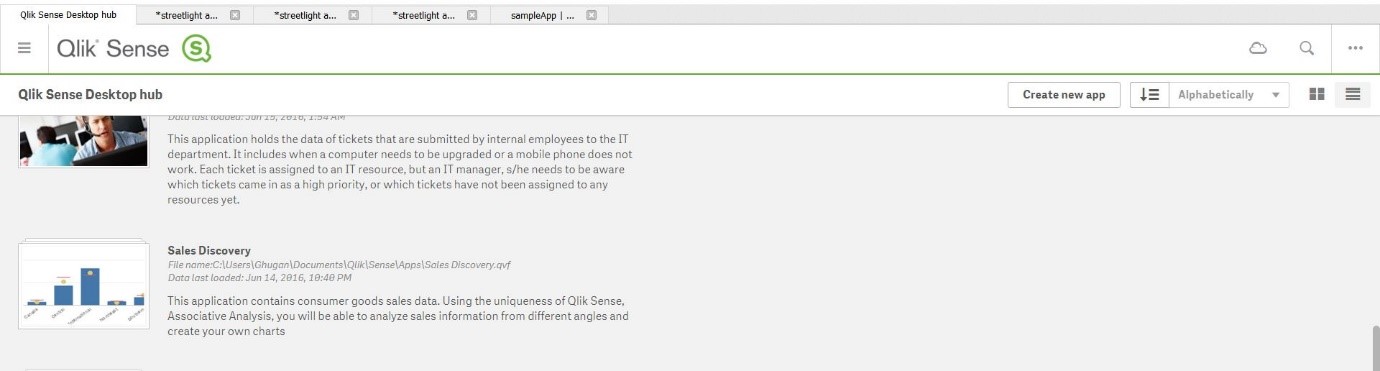
Data visualization with Qlik Sense
A free data visualization and discovery tool that lets you analyze data easily and make business decisions fast. Qlik Sense Desktop is a free product that enables you to create interactive reports and dashboards with stunning charts and graphs. The visualization software simplifies data analysis and helps you make informed business decisions faster than ever before.
Installation
Register for an account here to download the Qlik Sense desktop.
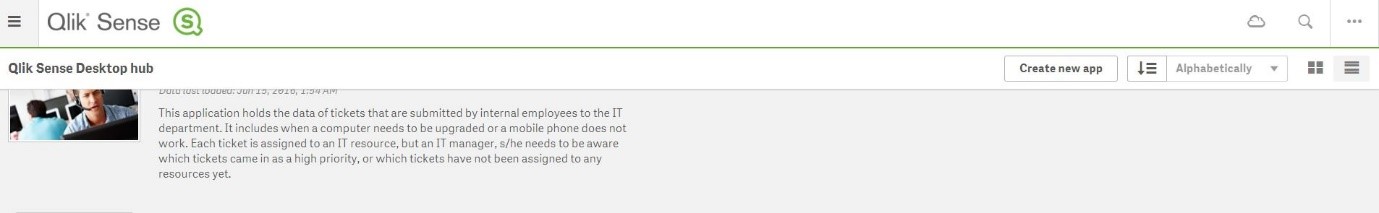
Generating Dashboard
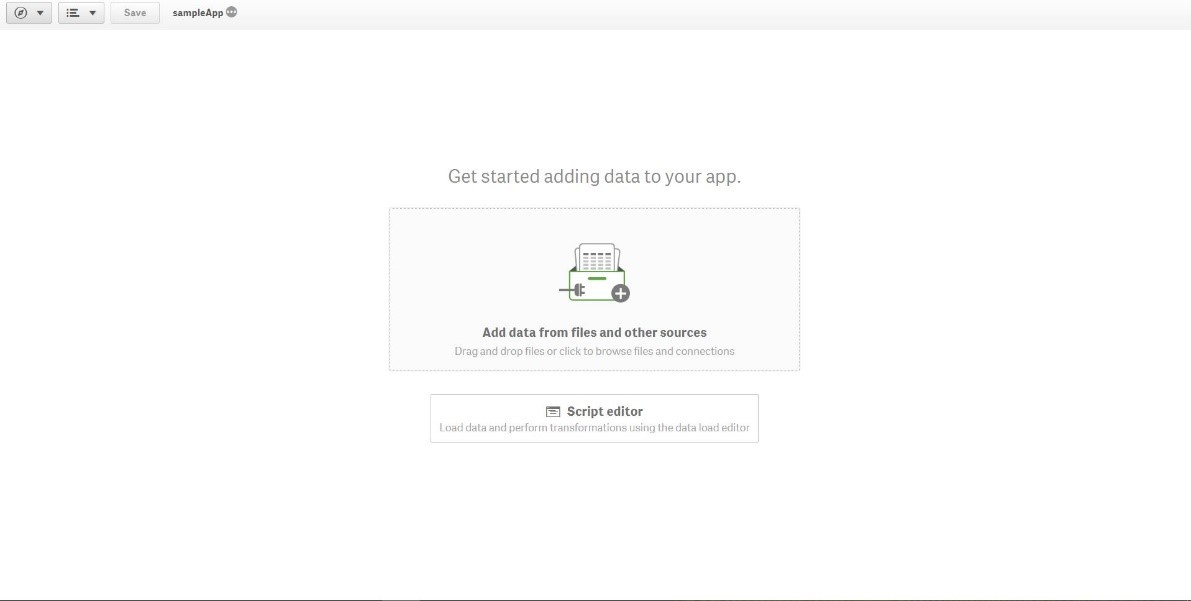
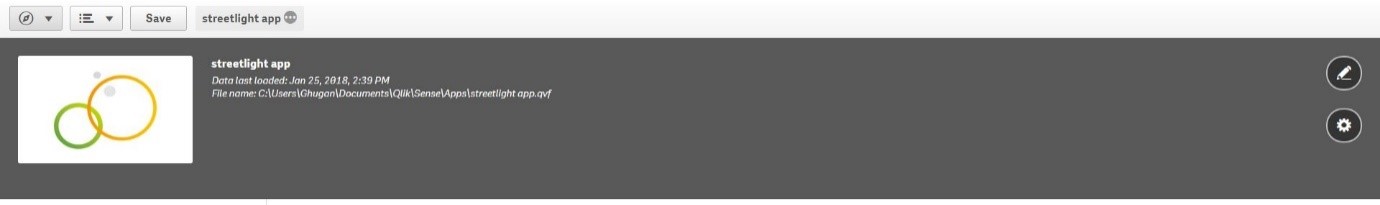
Clik on “Create new app” button to create a new dashboard sheet.
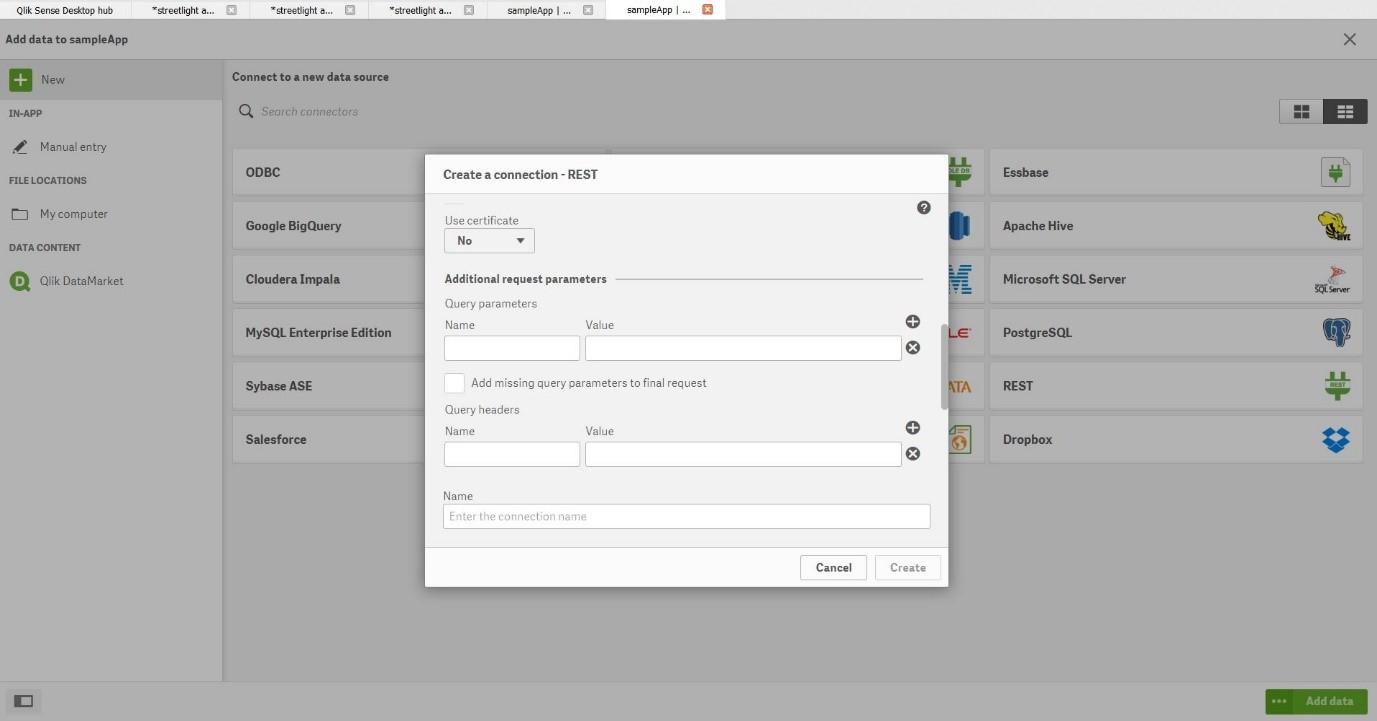
Click on “Open app” and choose the option “Add data from files and other sources” to import data from REST API or Excel.
To import REST API data click on REST button. Key in the URL, method, authentication schema and query headers (if exist) and click on “create” button. Click here for guidelines to import REST API data.
Click on “Add data” after necessary changes made to the data. Click on “table” button to edit the data.
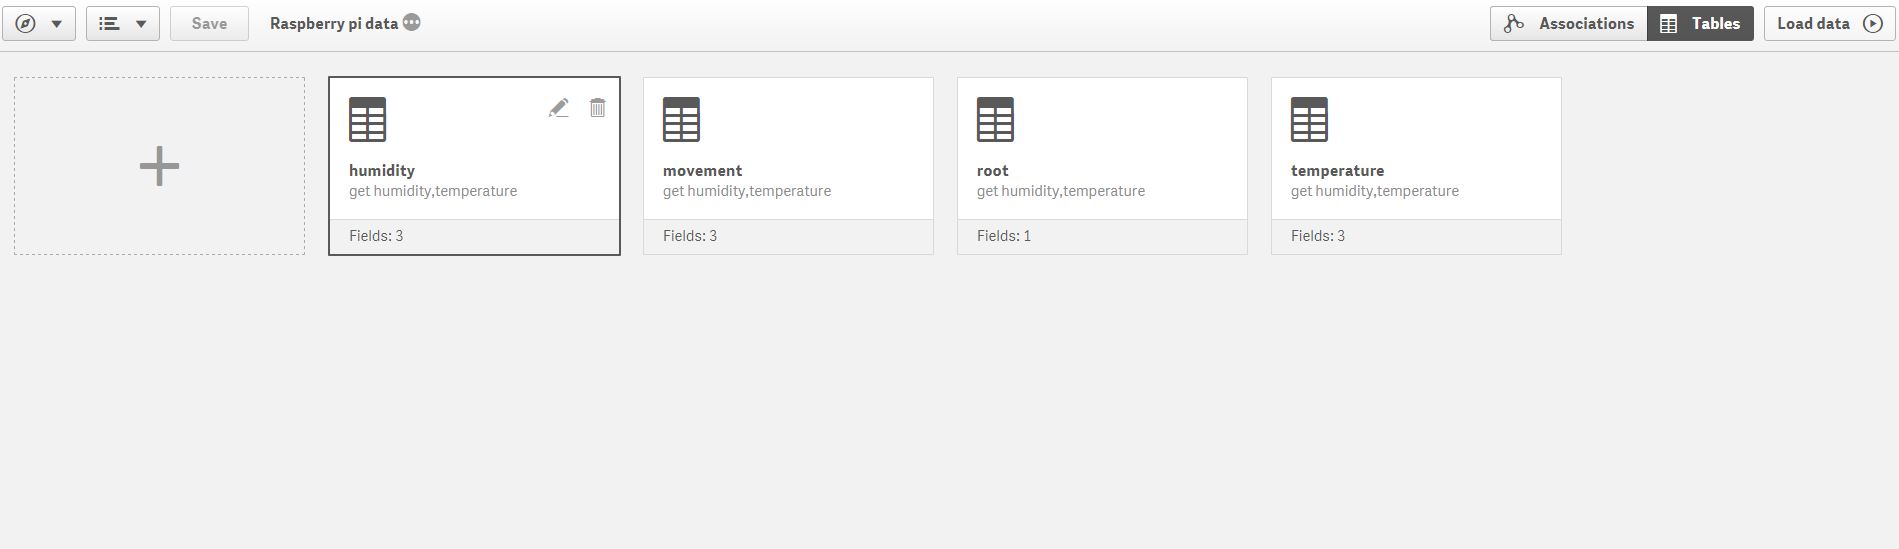
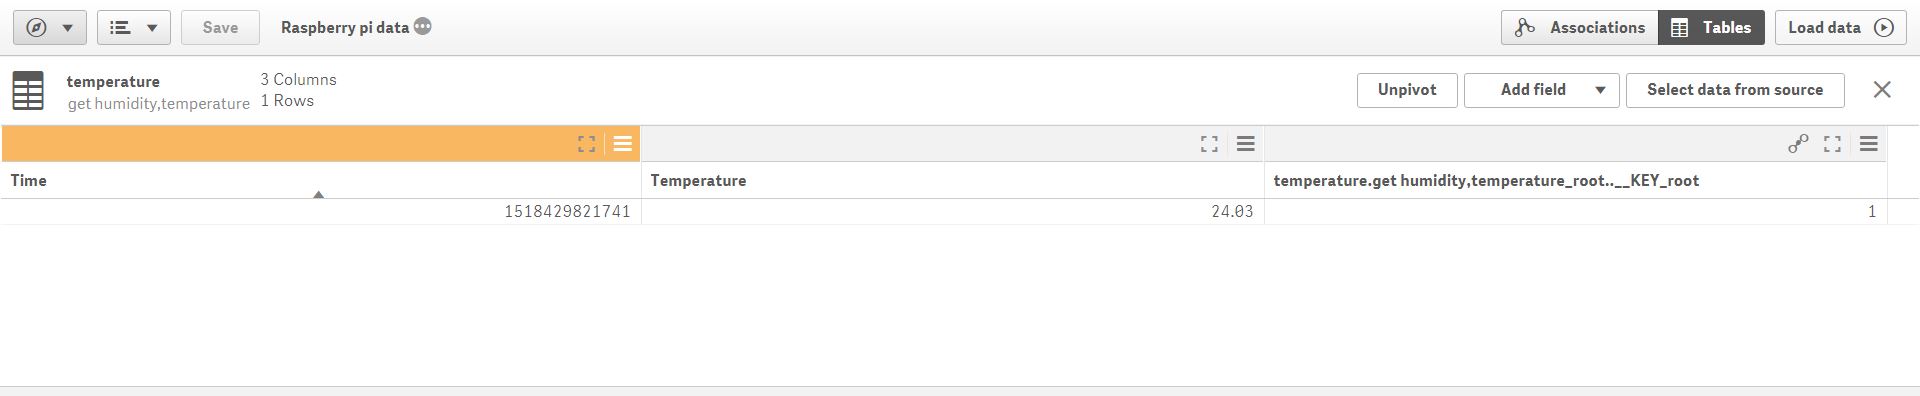
Click on the edit icon in the table “temperature” to change the name of the field, to create a new field and so on.
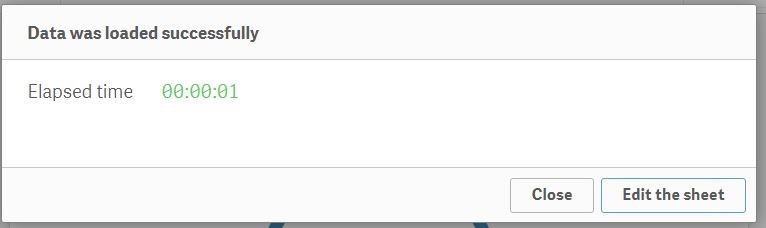
Click on “Load data” after making necessary changes. Click on edit the sheet upon receiving a pop up menu.
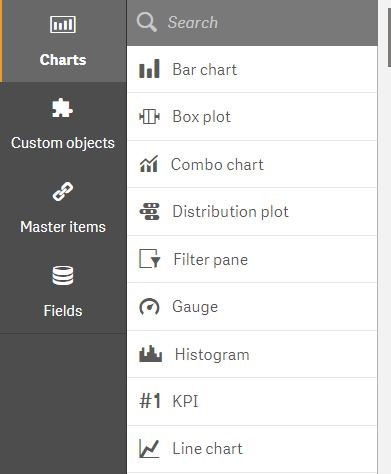
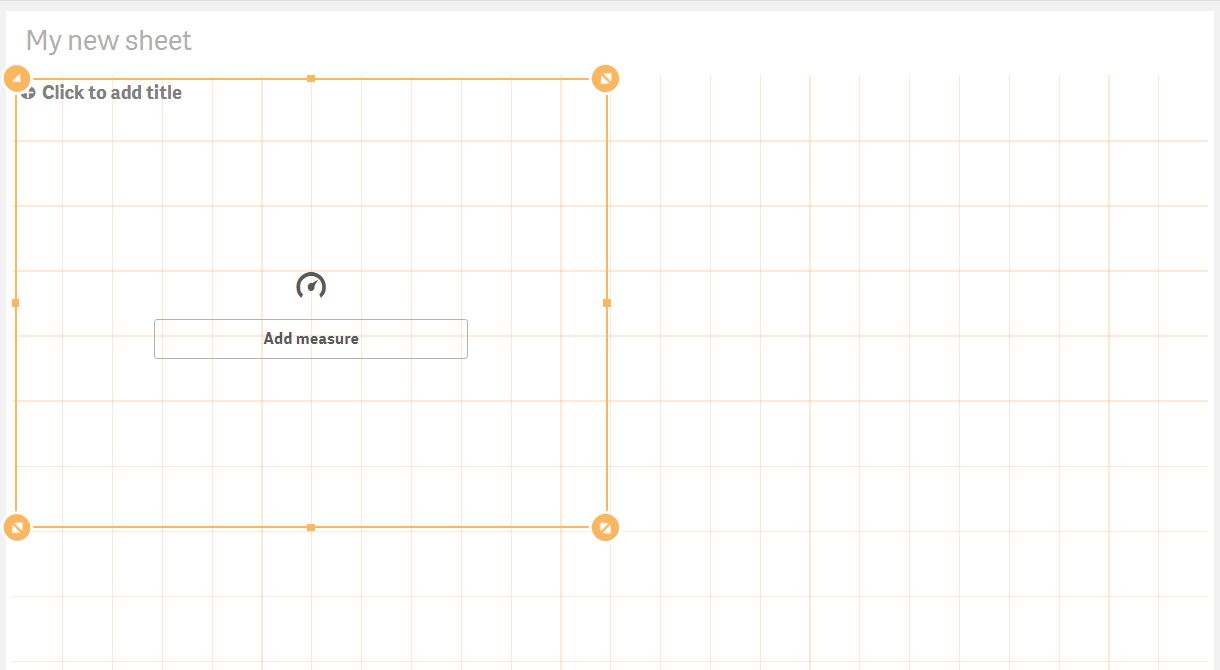
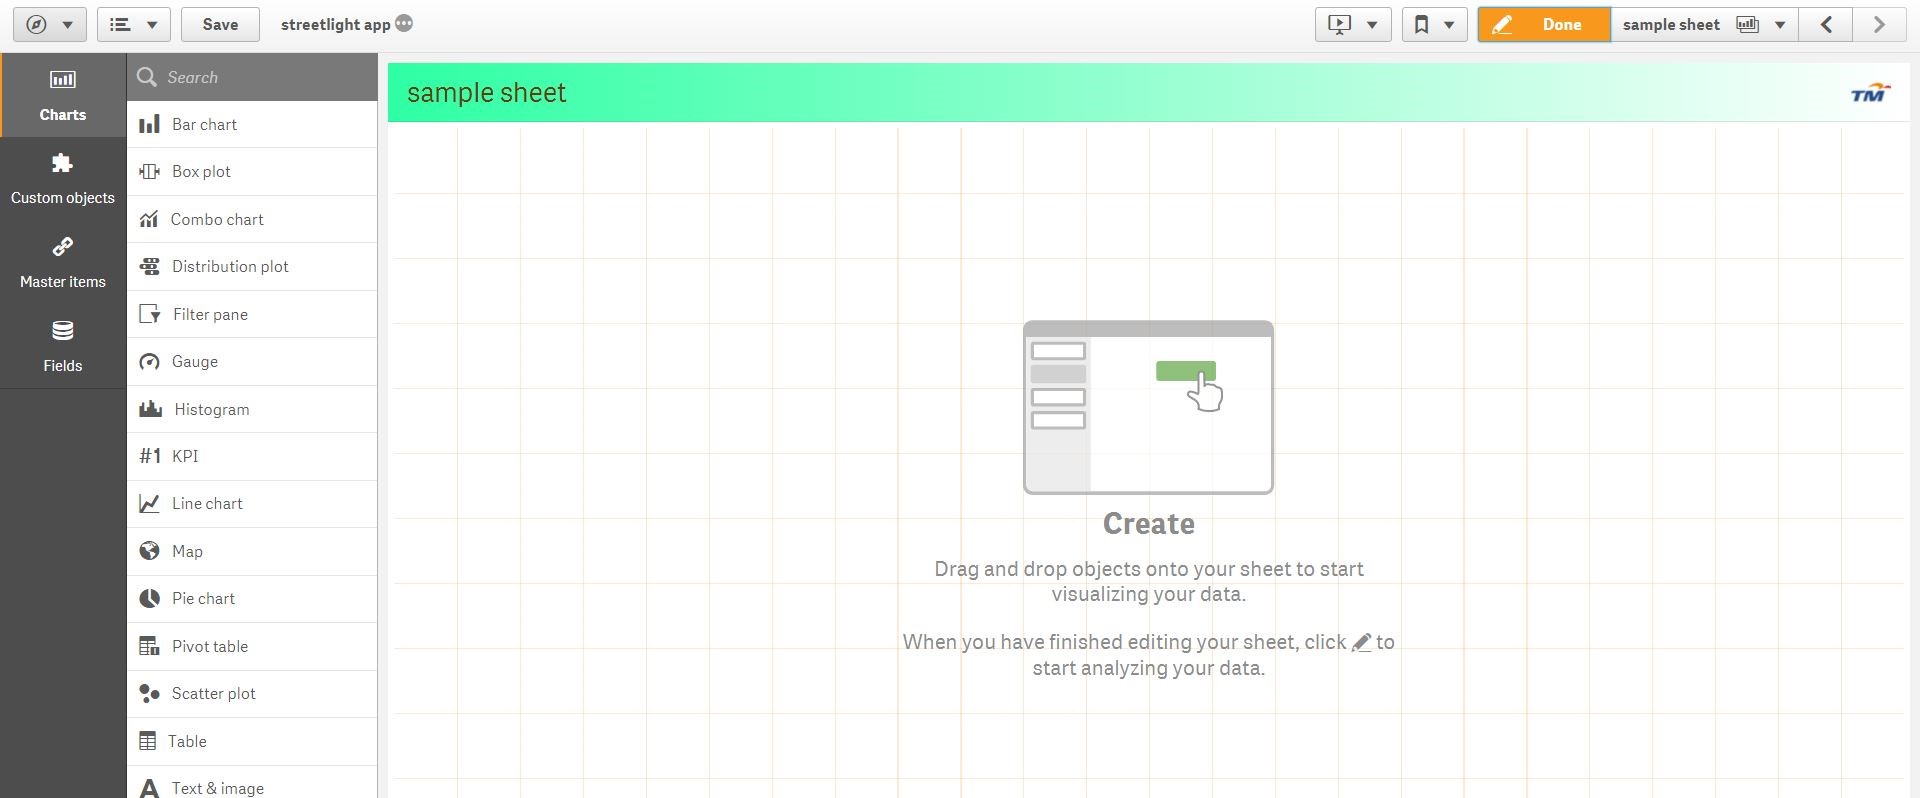
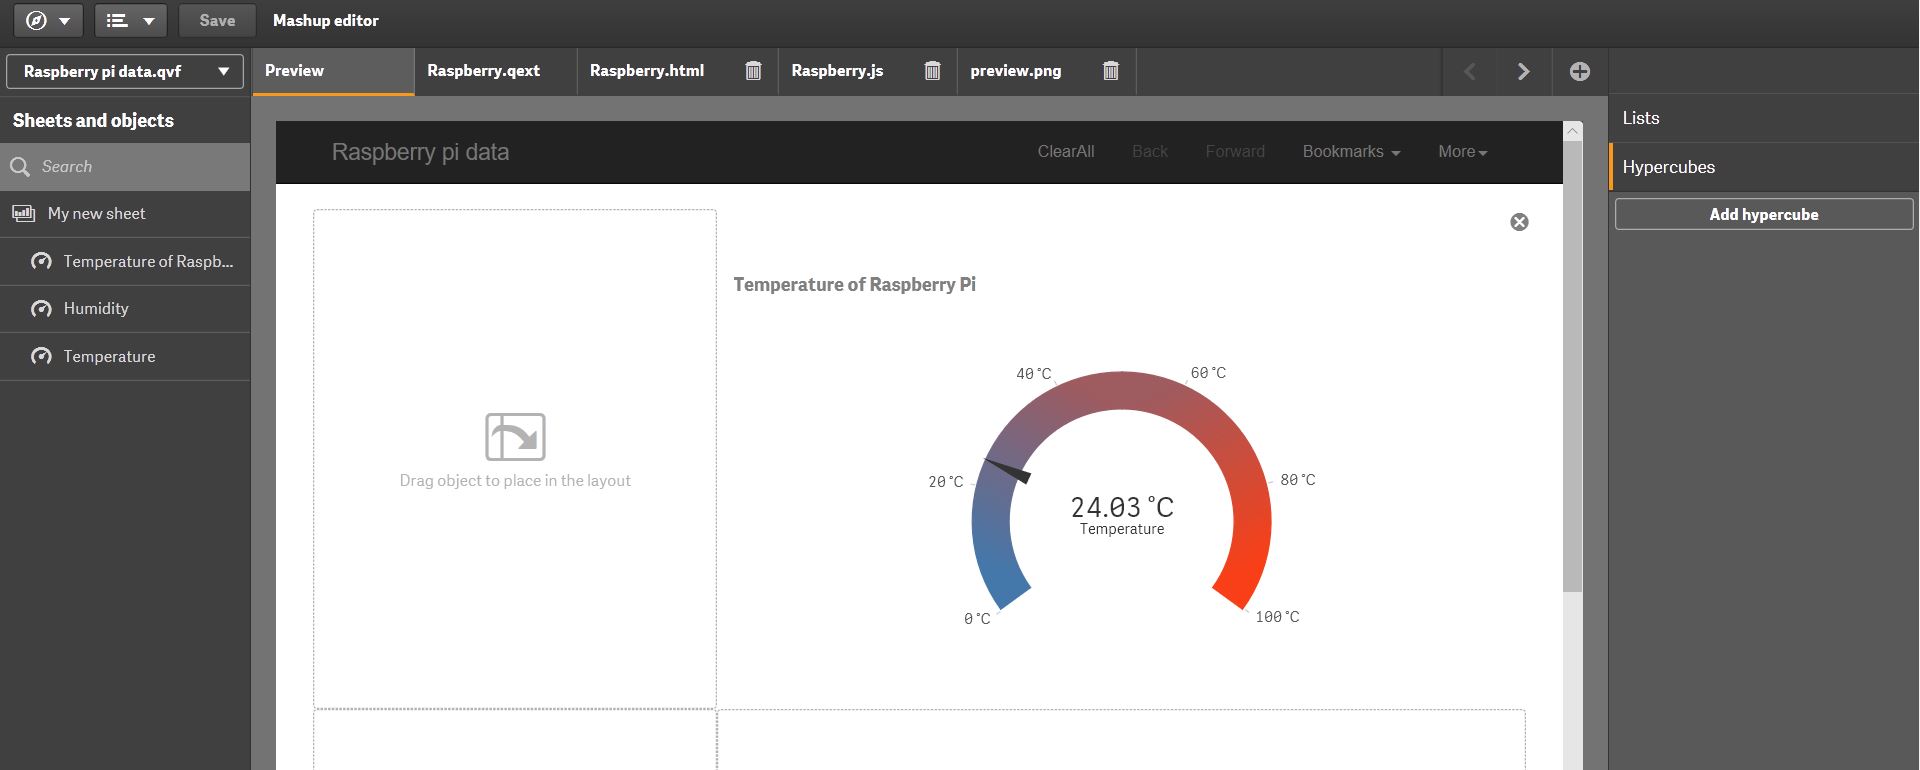
Click on charts and select “Gauge” to project a gauge meter into the sheets.
Click on the add measure and select Temperature and followed by Sum(Temperature).
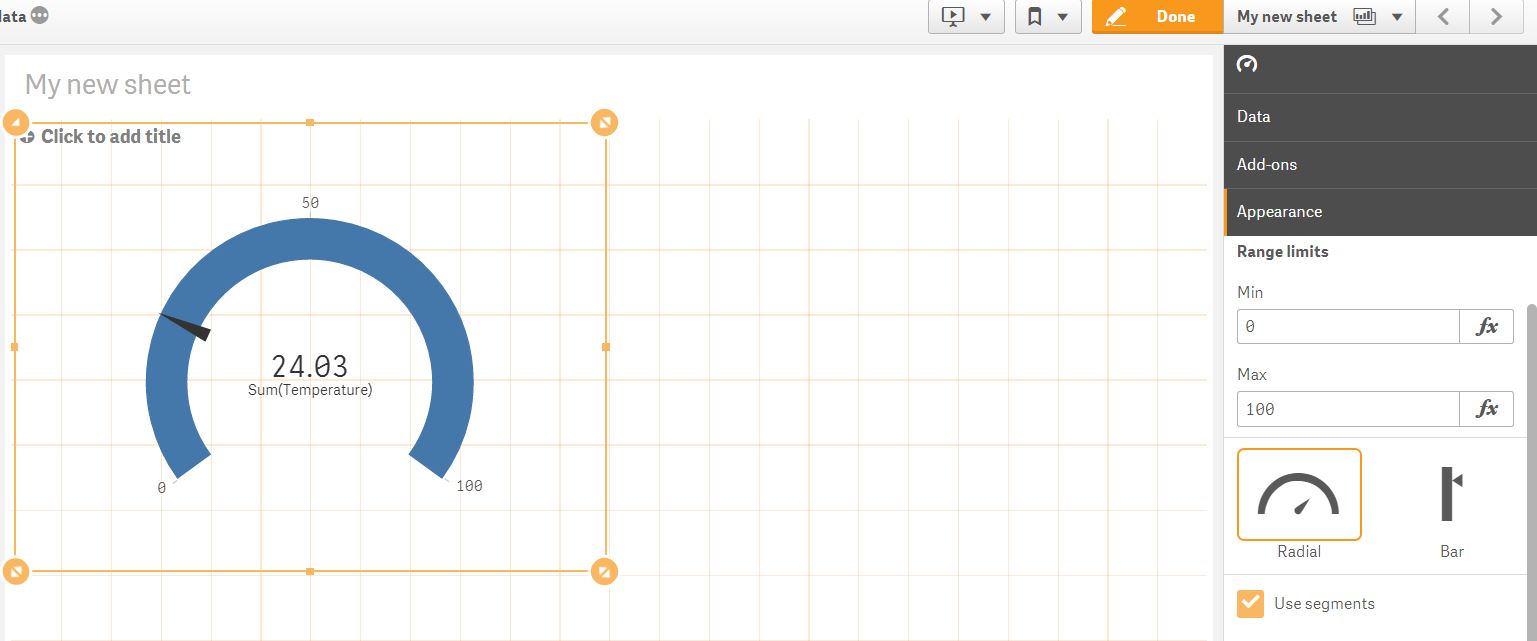
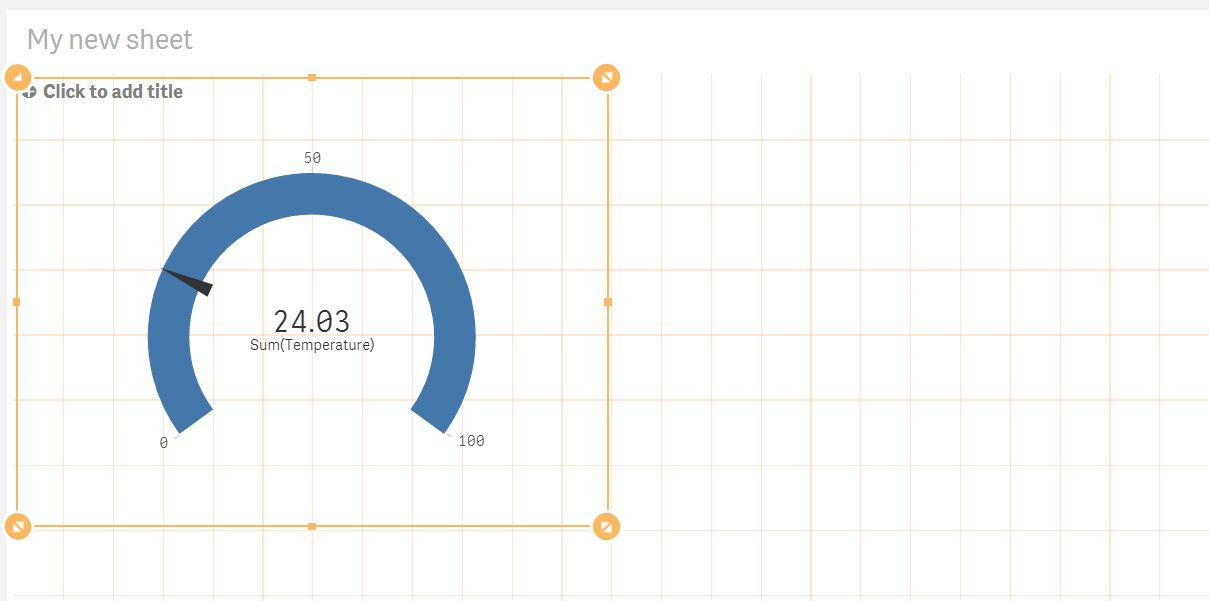
Click on Appearance and select presentation and check the option Use segments to add the indicator needle to the meter
Click on the title to edit the title of the line chart.
Click on Appearance and select presentation and click on add limit and set the limit to 50 and click on the different segments to set different color. Check the option Gradient to project gradient effect to the colors.
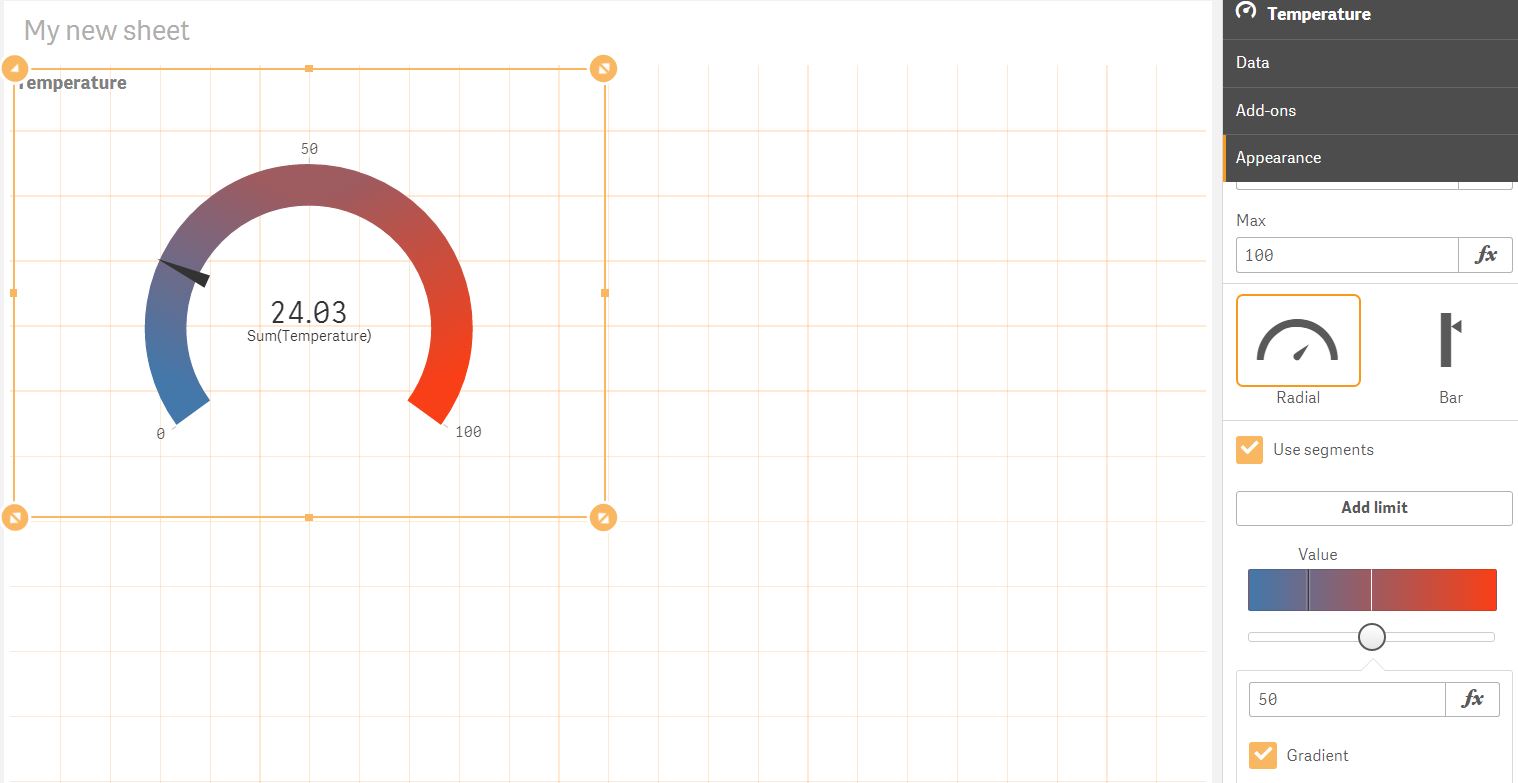
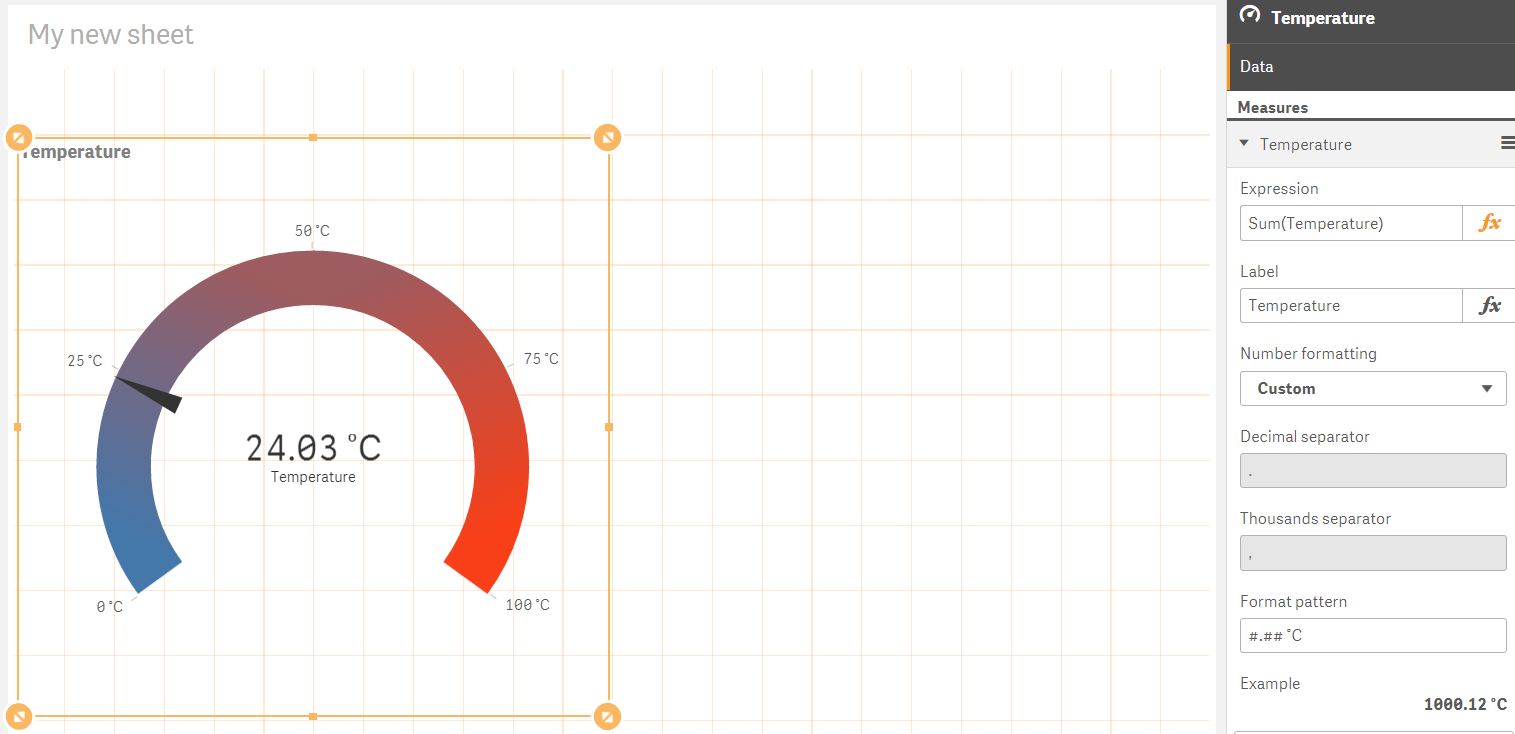
Click on Data and select Temperature and change the number formatting to custom and set the format pattern to #.## °C to change the unit to celsius.
Click on “done” when done with editing.
The header of the page can be edited by clicking on the “…” next to the title of the sheet.
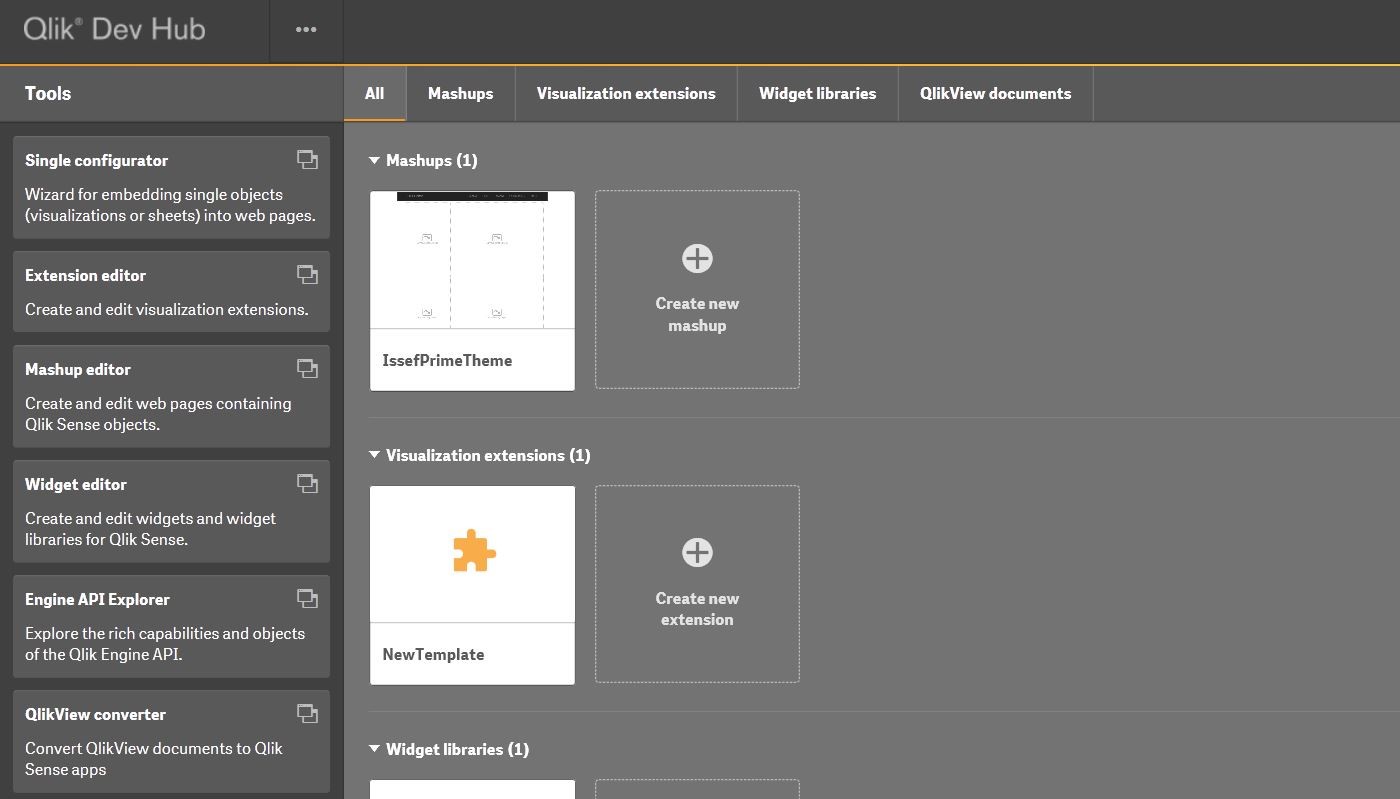
To create a webpage with using the sheets created, go to home and click on “…” located at the most right of the page and select “Dev Hub”.
Click on “mashup editor” to make a webpage with the sheets data.
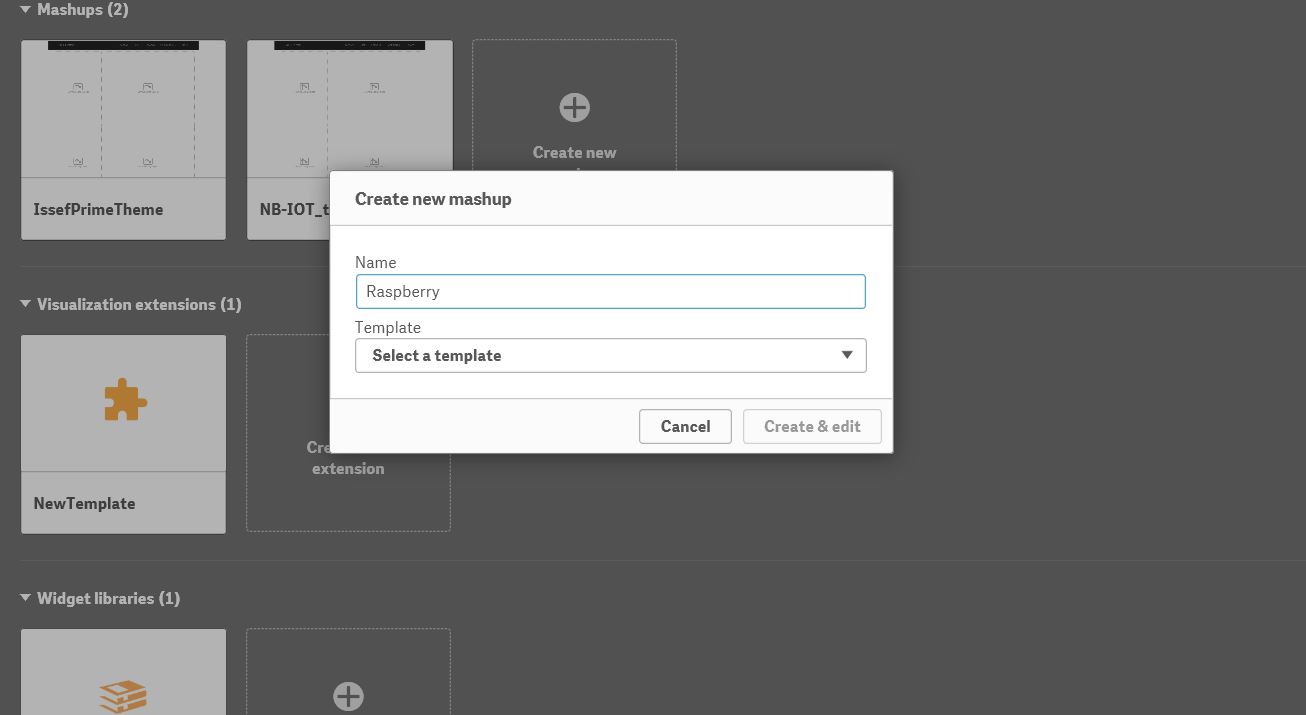
Click on create new mashup to create a new page template. Select Grid mashup template for the page.
Click on the “select an app” to select the sheets to be included into the page.
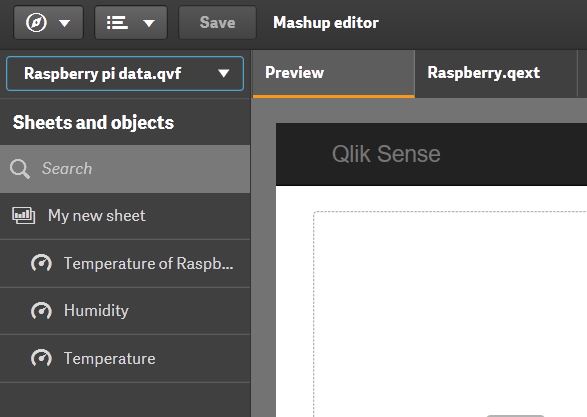
Drag and drop the charts on the left panel and drop it on the desired layout in the page.
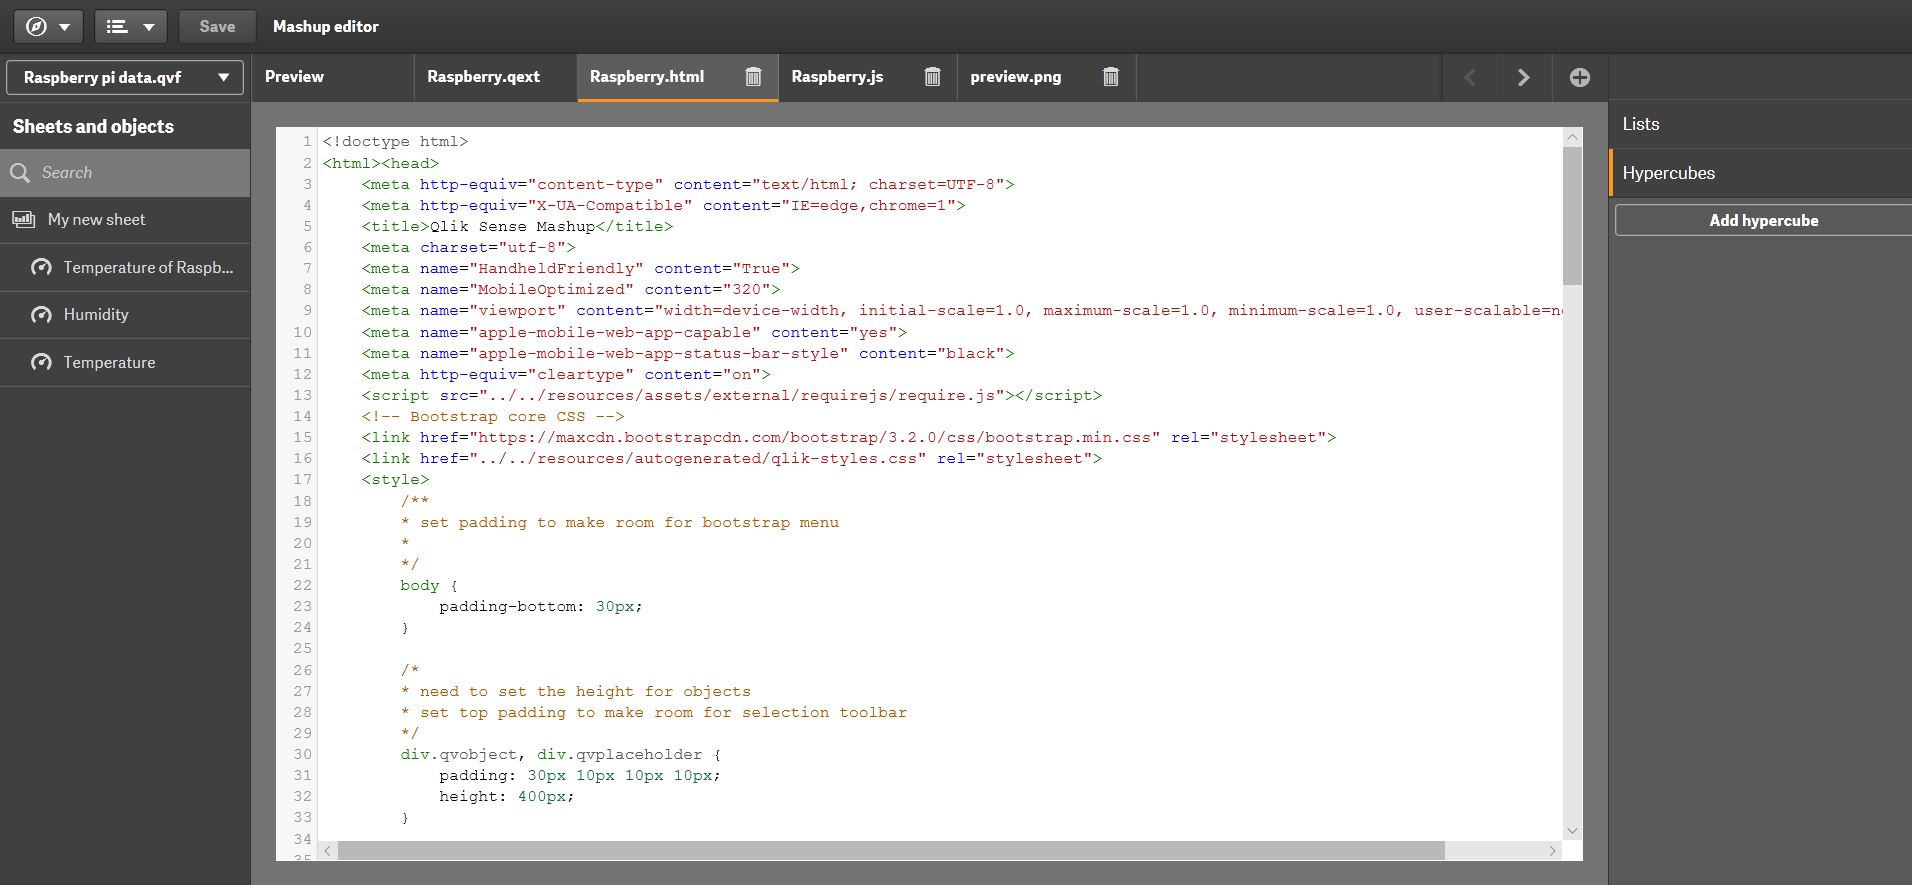
Html page can be edited by accessing the html tab.
REST API to Populate the Dashboard
URL : Authentication
https://api.oip.tm.com.my/app/t/tmrnd.com.my/iot/1.0/api/auth/login
METHOD : POST

HEADER
Authorization: <Access Token>

BODY
{
"username": <email>,
"password": <password>
}

RESPONSE
{
"token": $JWT_TOKEN,
"refreshToken": $REFRESH_TOKEN
}
URL: Get Humidity and temperature
https://api.oip.tm.com.my/app/t/tmrnd.com.my/iot/1.0/api/plugins/telemetry/DEVICE/<Device ID>/values/timeseries?keys=humidity,temp
METHOD : GET

PARAMETERS : keys=temperature,humidity

HEADERS
X-Authorization: <Your access token for Service creation platform>
Authorization : <Your access token for service platform>
Data visualization with Freeboard
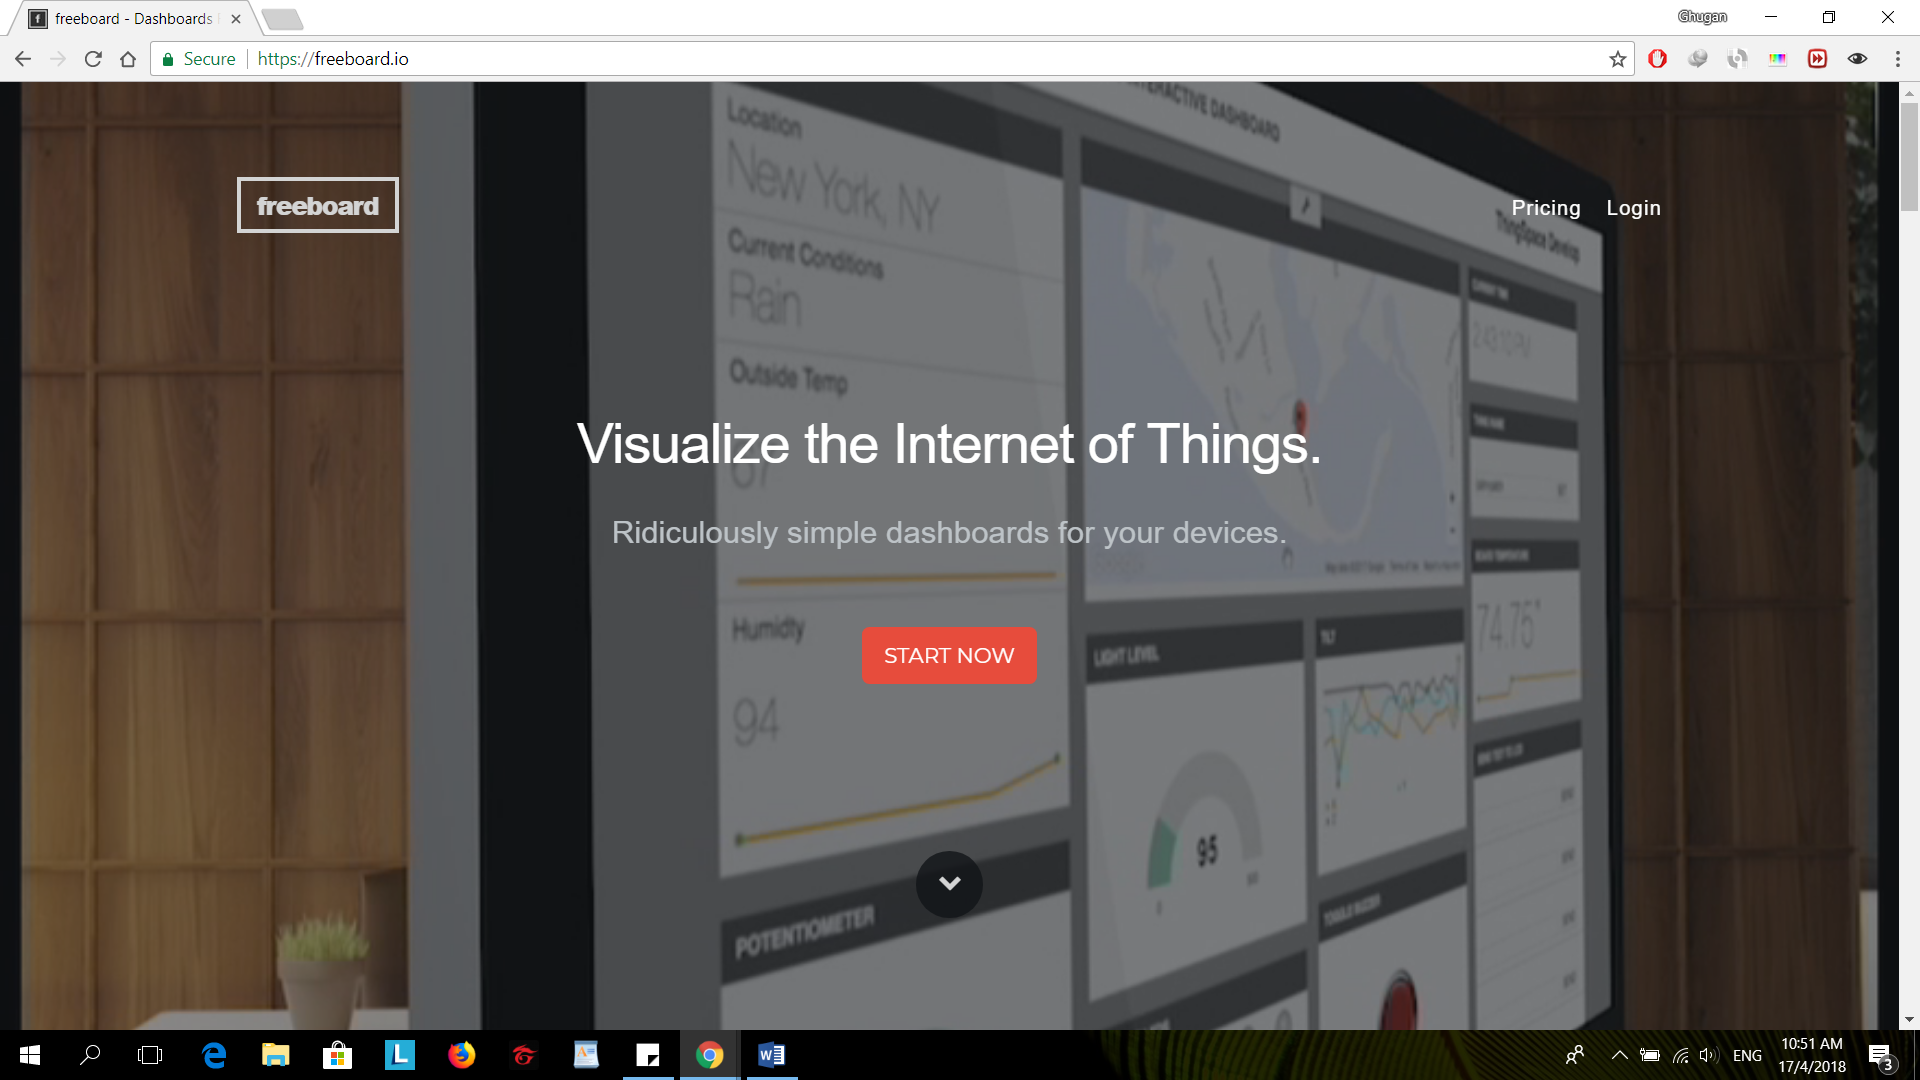
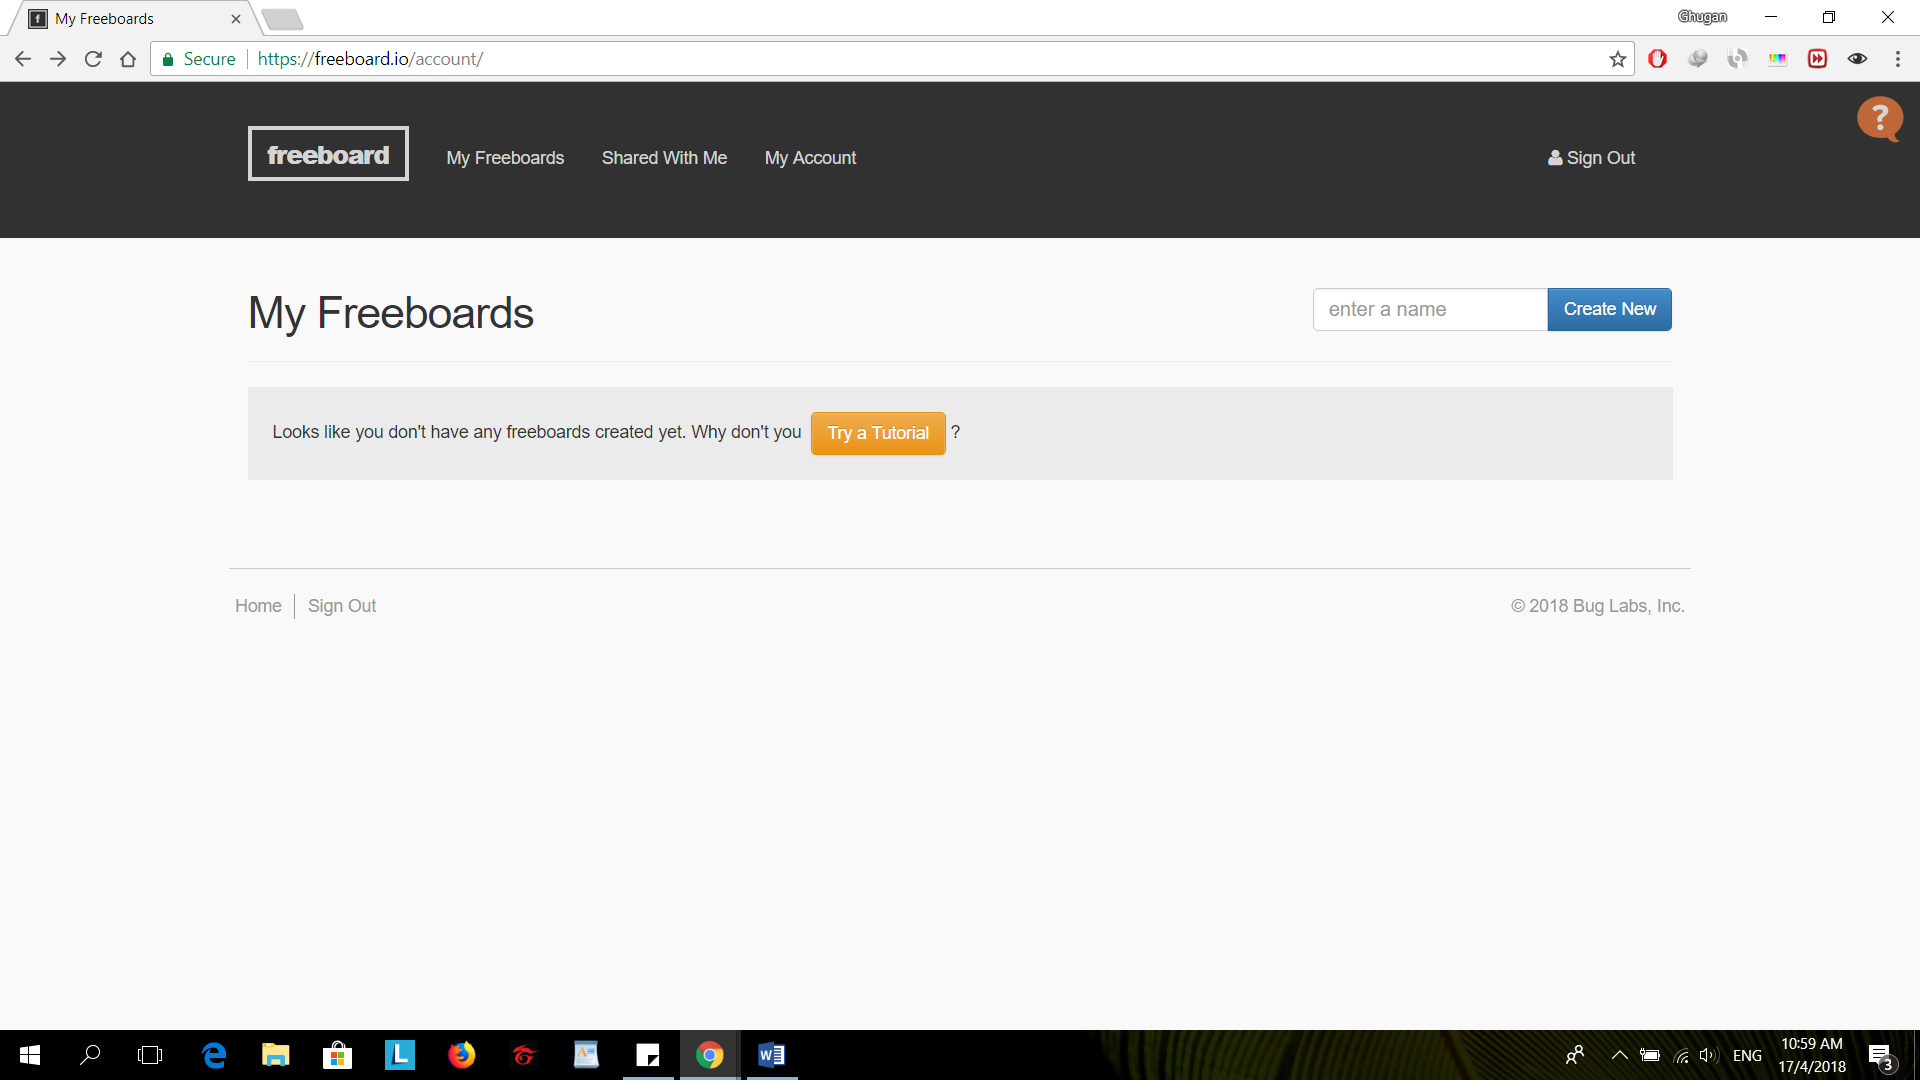
Go to freeboard.io and click on start now to create a new account.
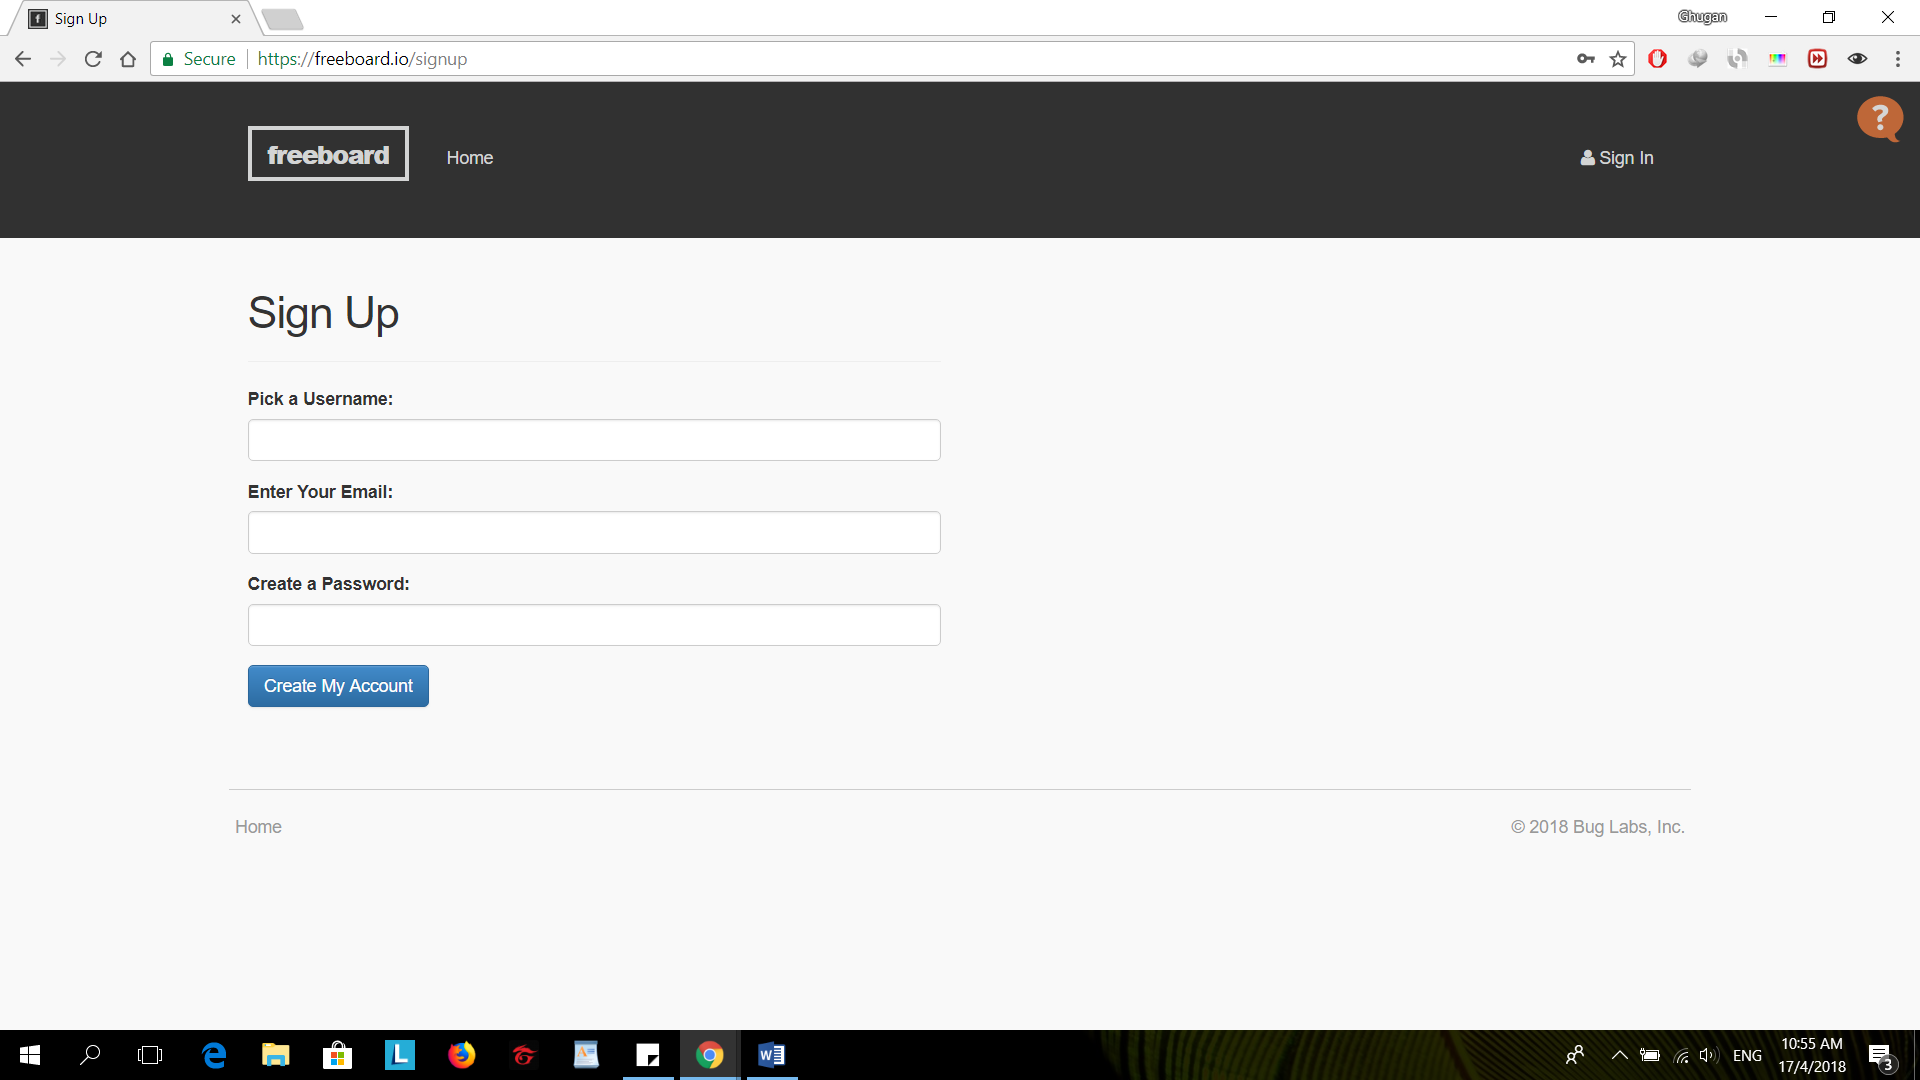
Enter a username, followed by email and password for your account and click create My Account.
Enter a name and click on Create New button to create new dashboard.
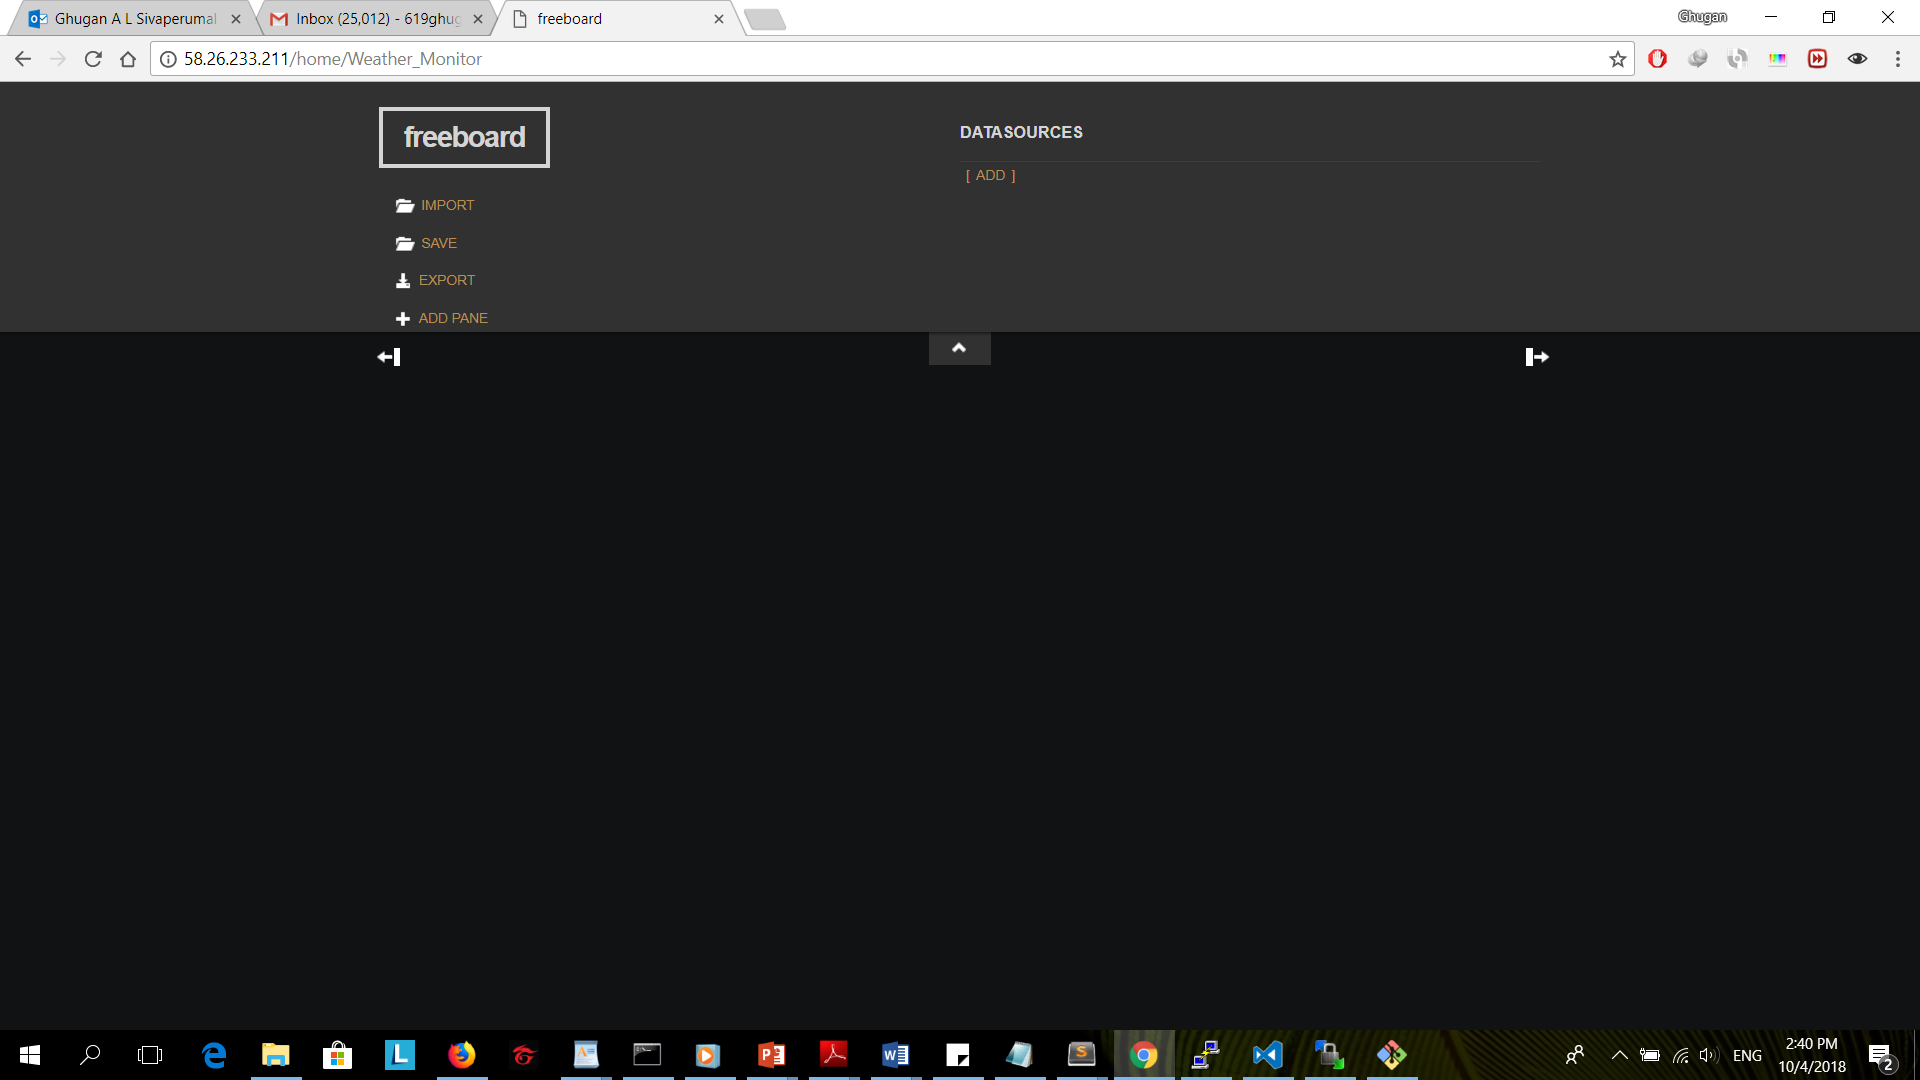
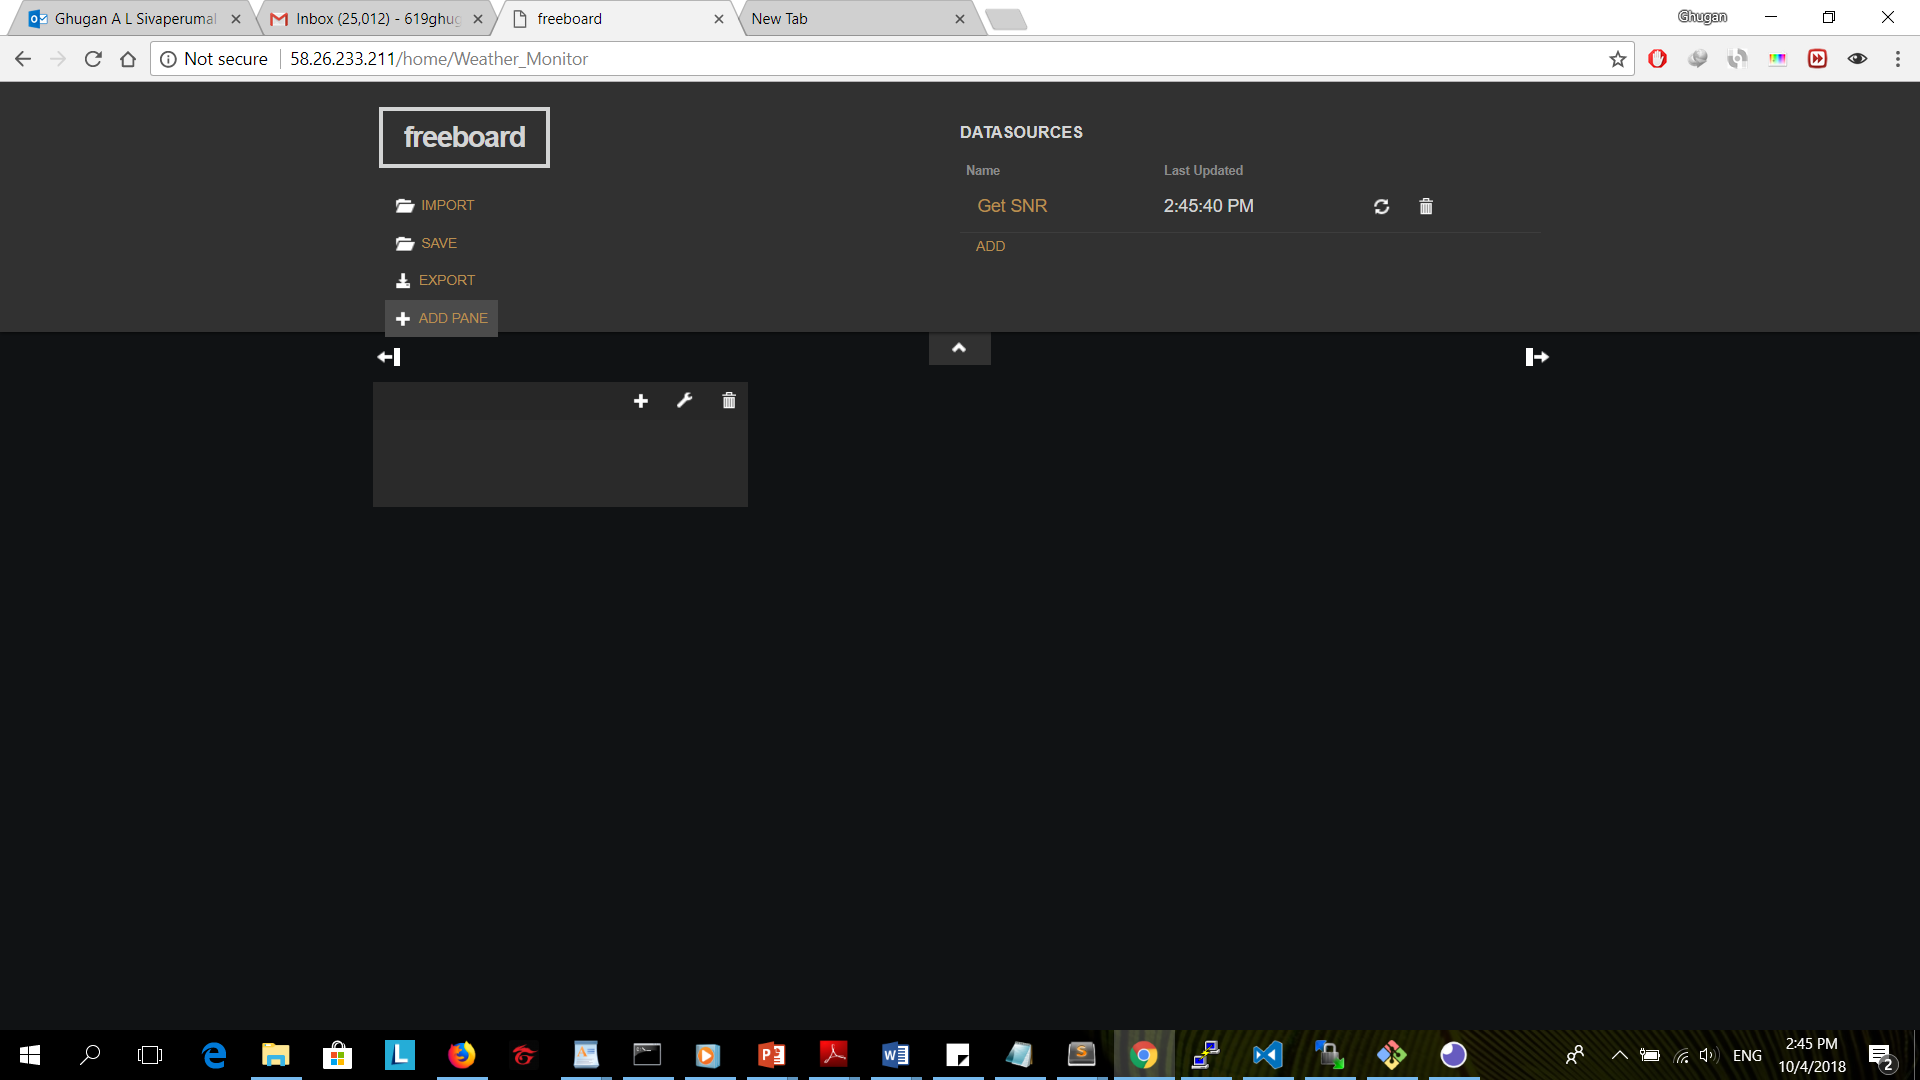
Click on add button at datasources to import data into freeboard.
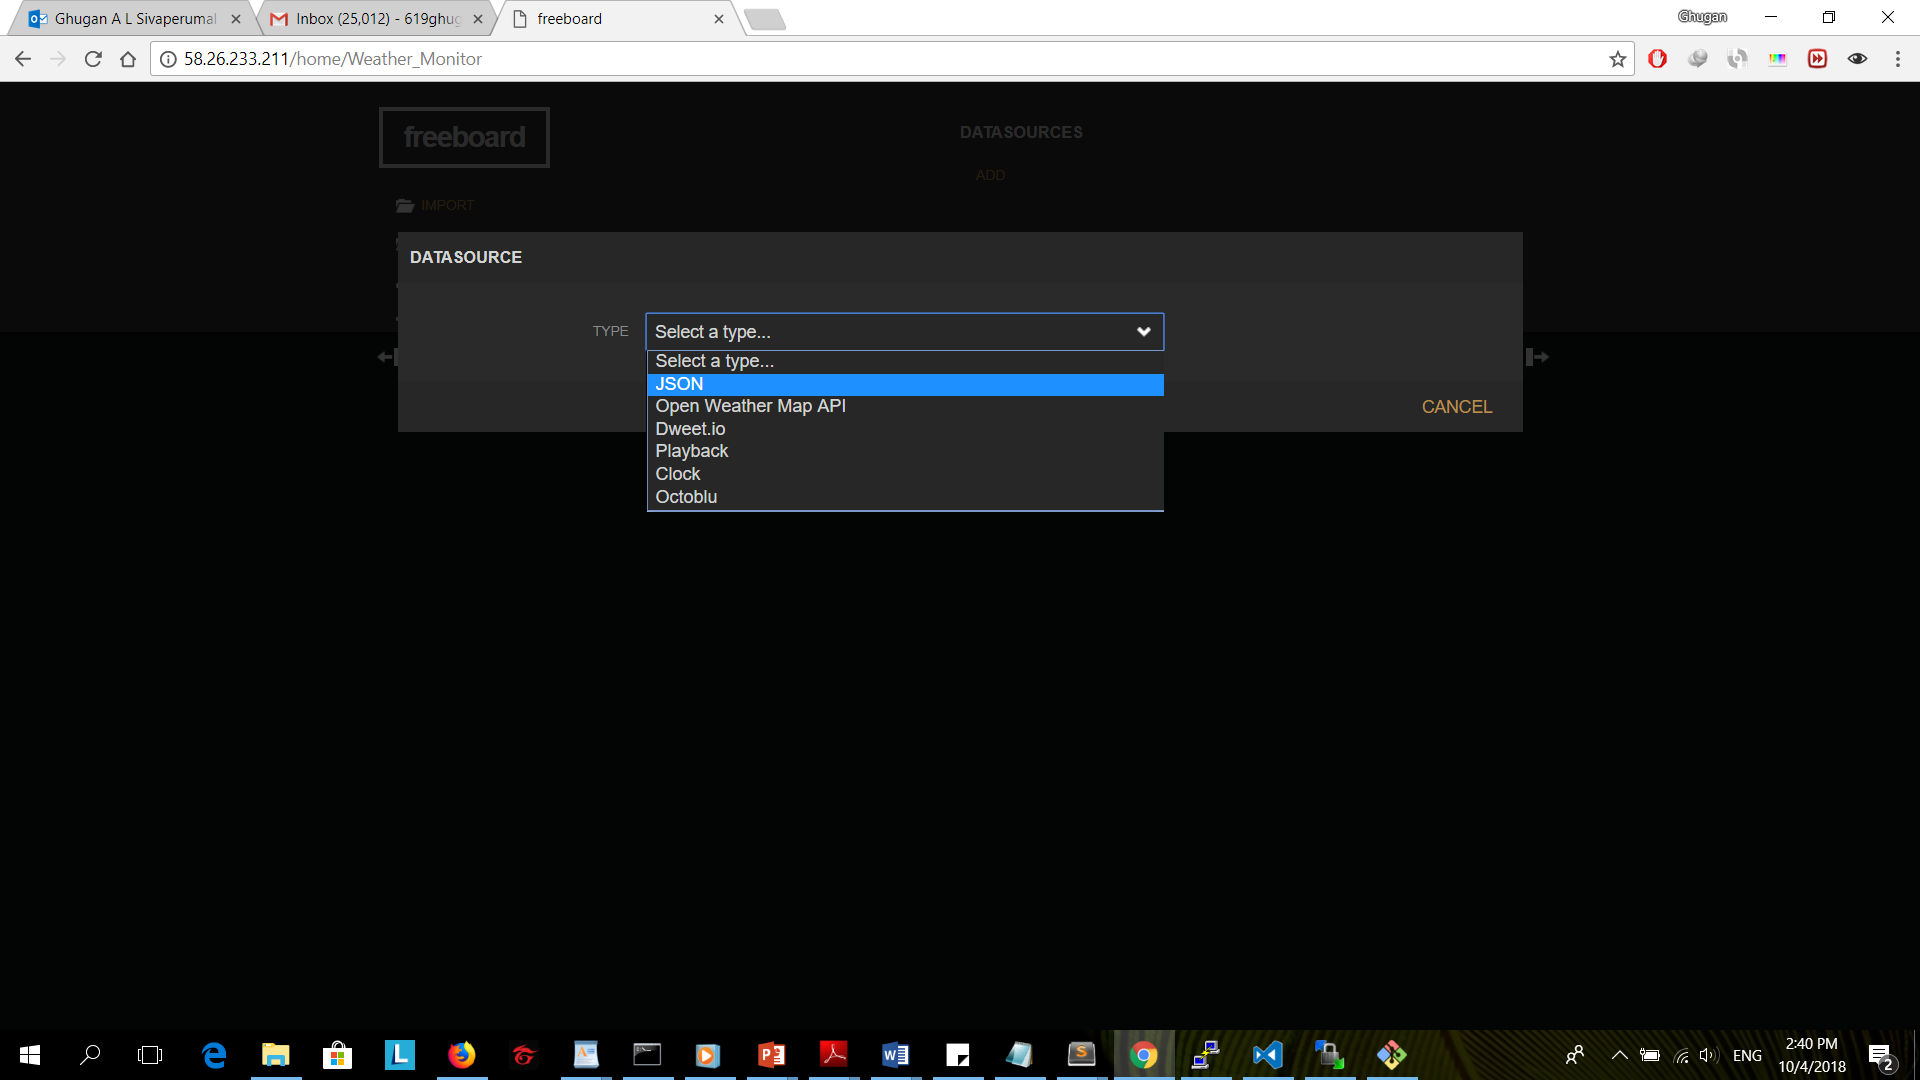
Select “JSON” to import a data using REST API.
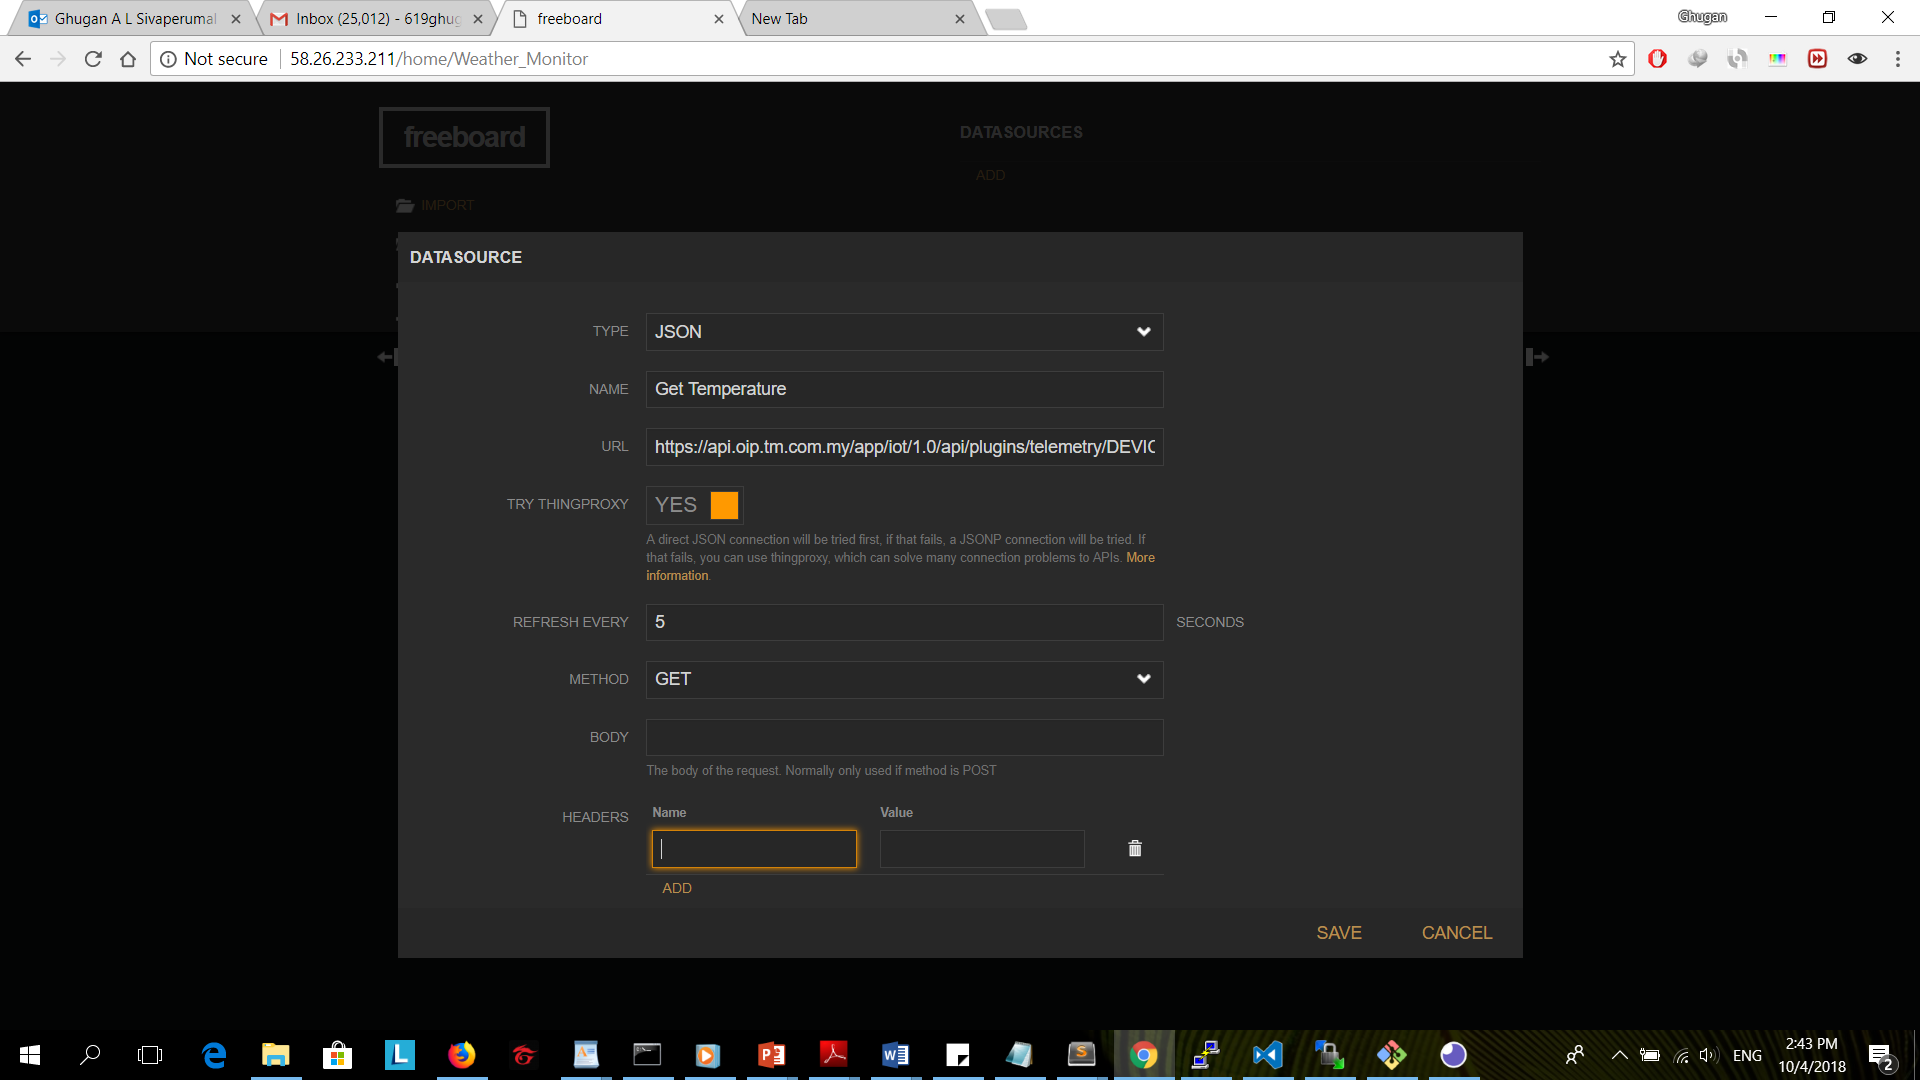
Key in the url,method and headers for the api.Click here for details on the REST API.
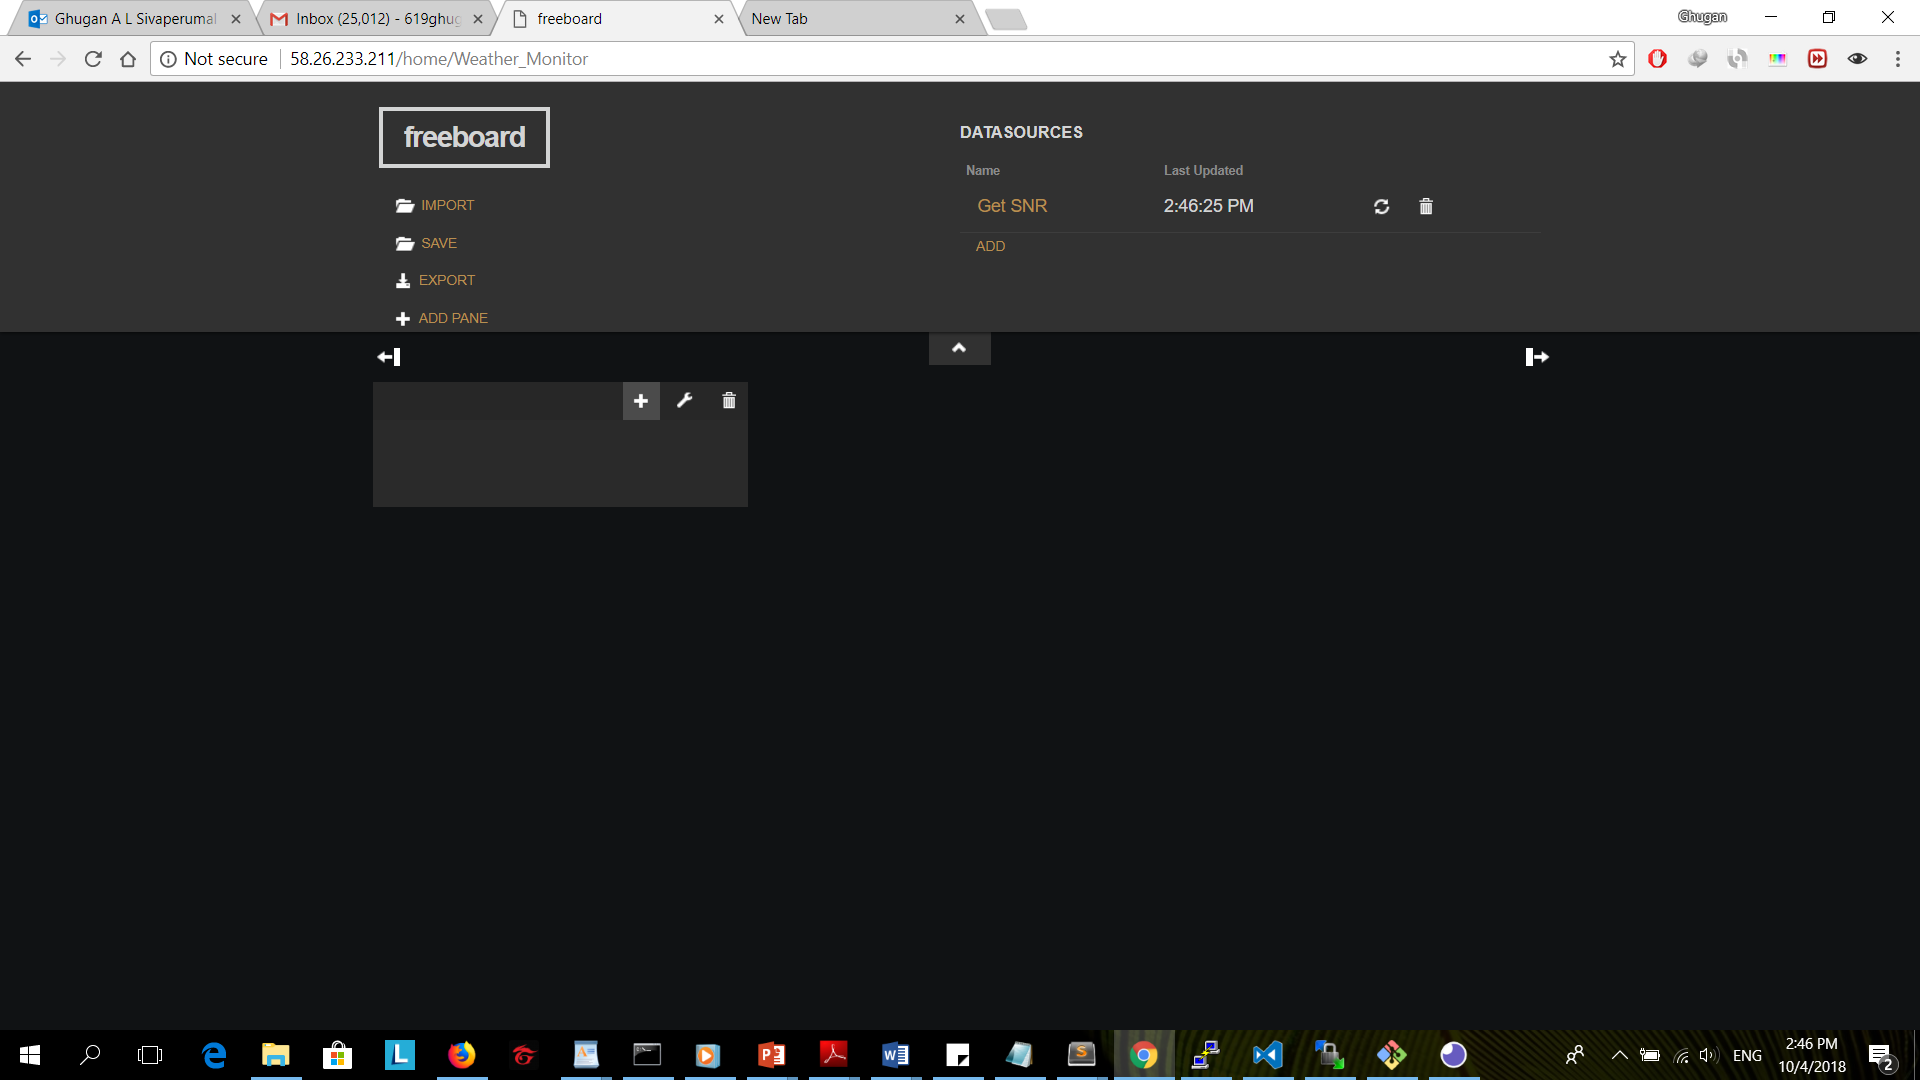
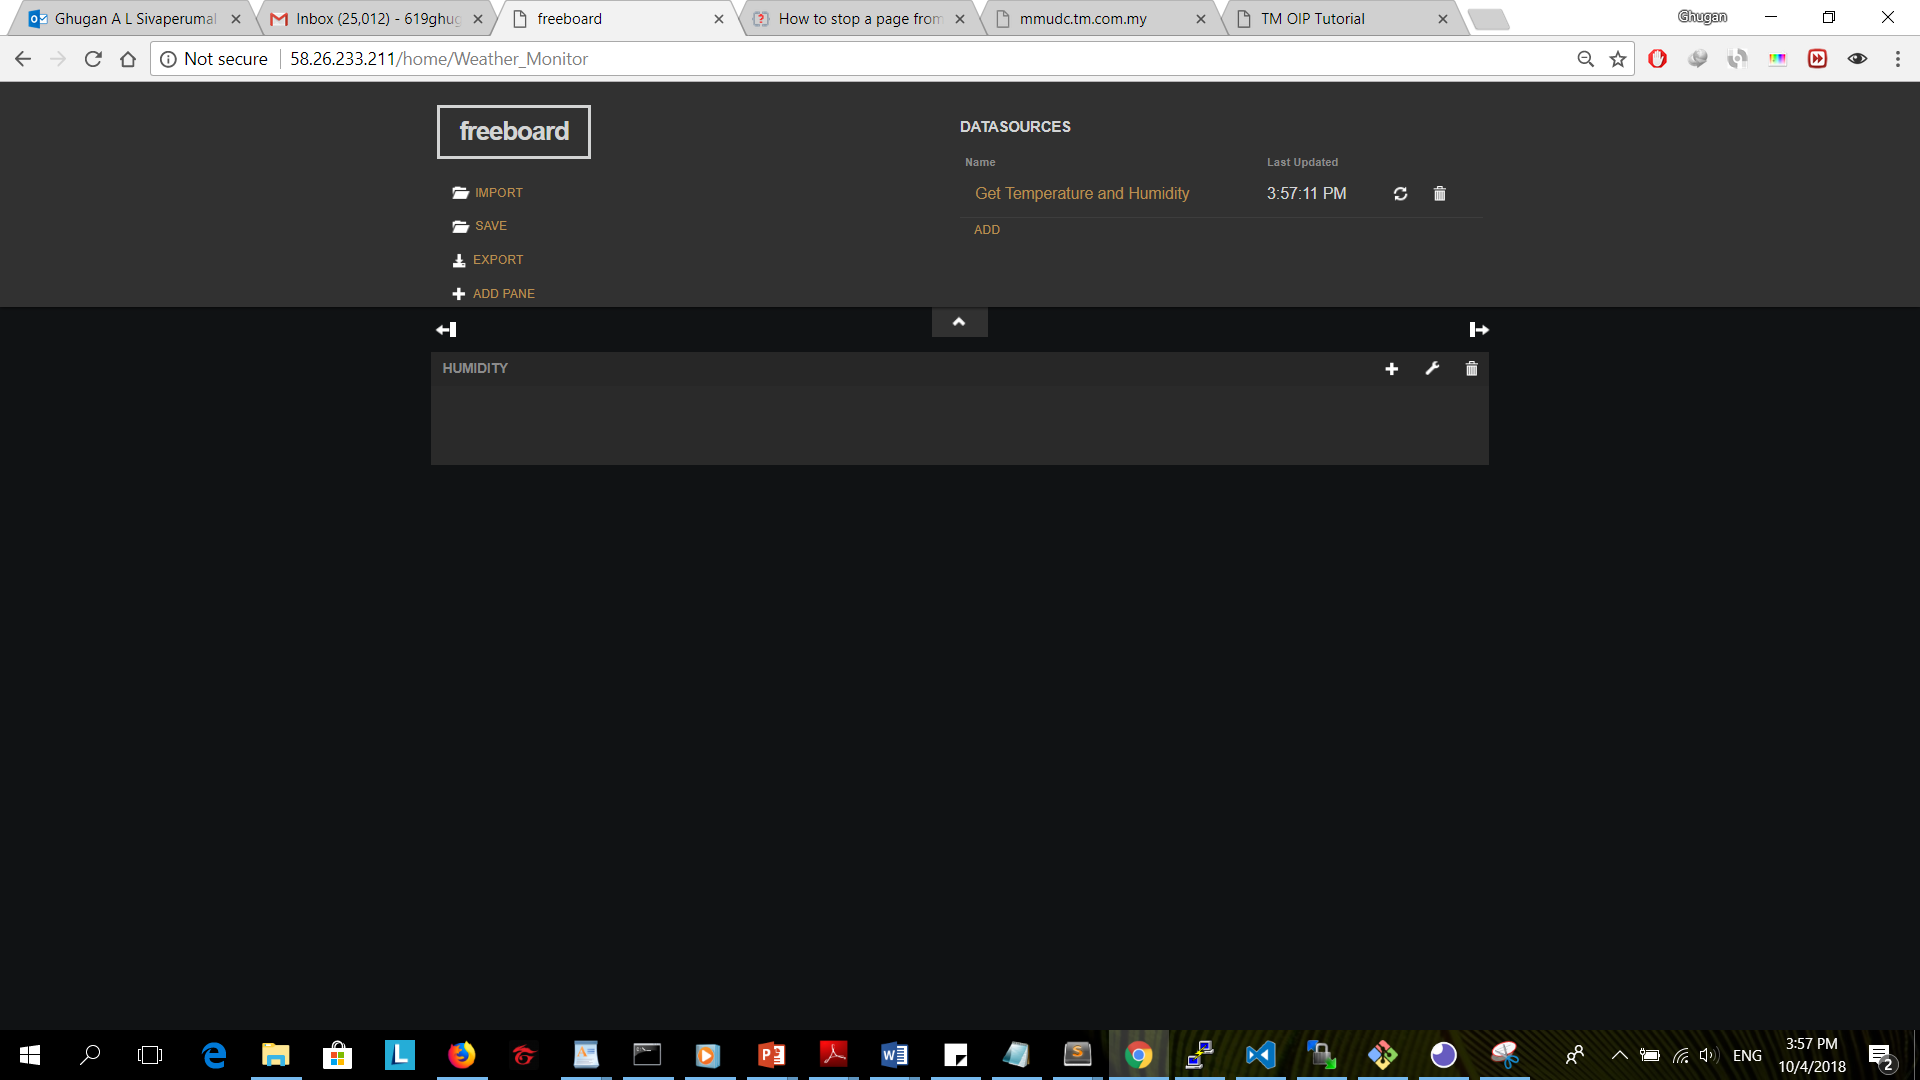
Click on “add pane” to add a widget panel into dashboard.
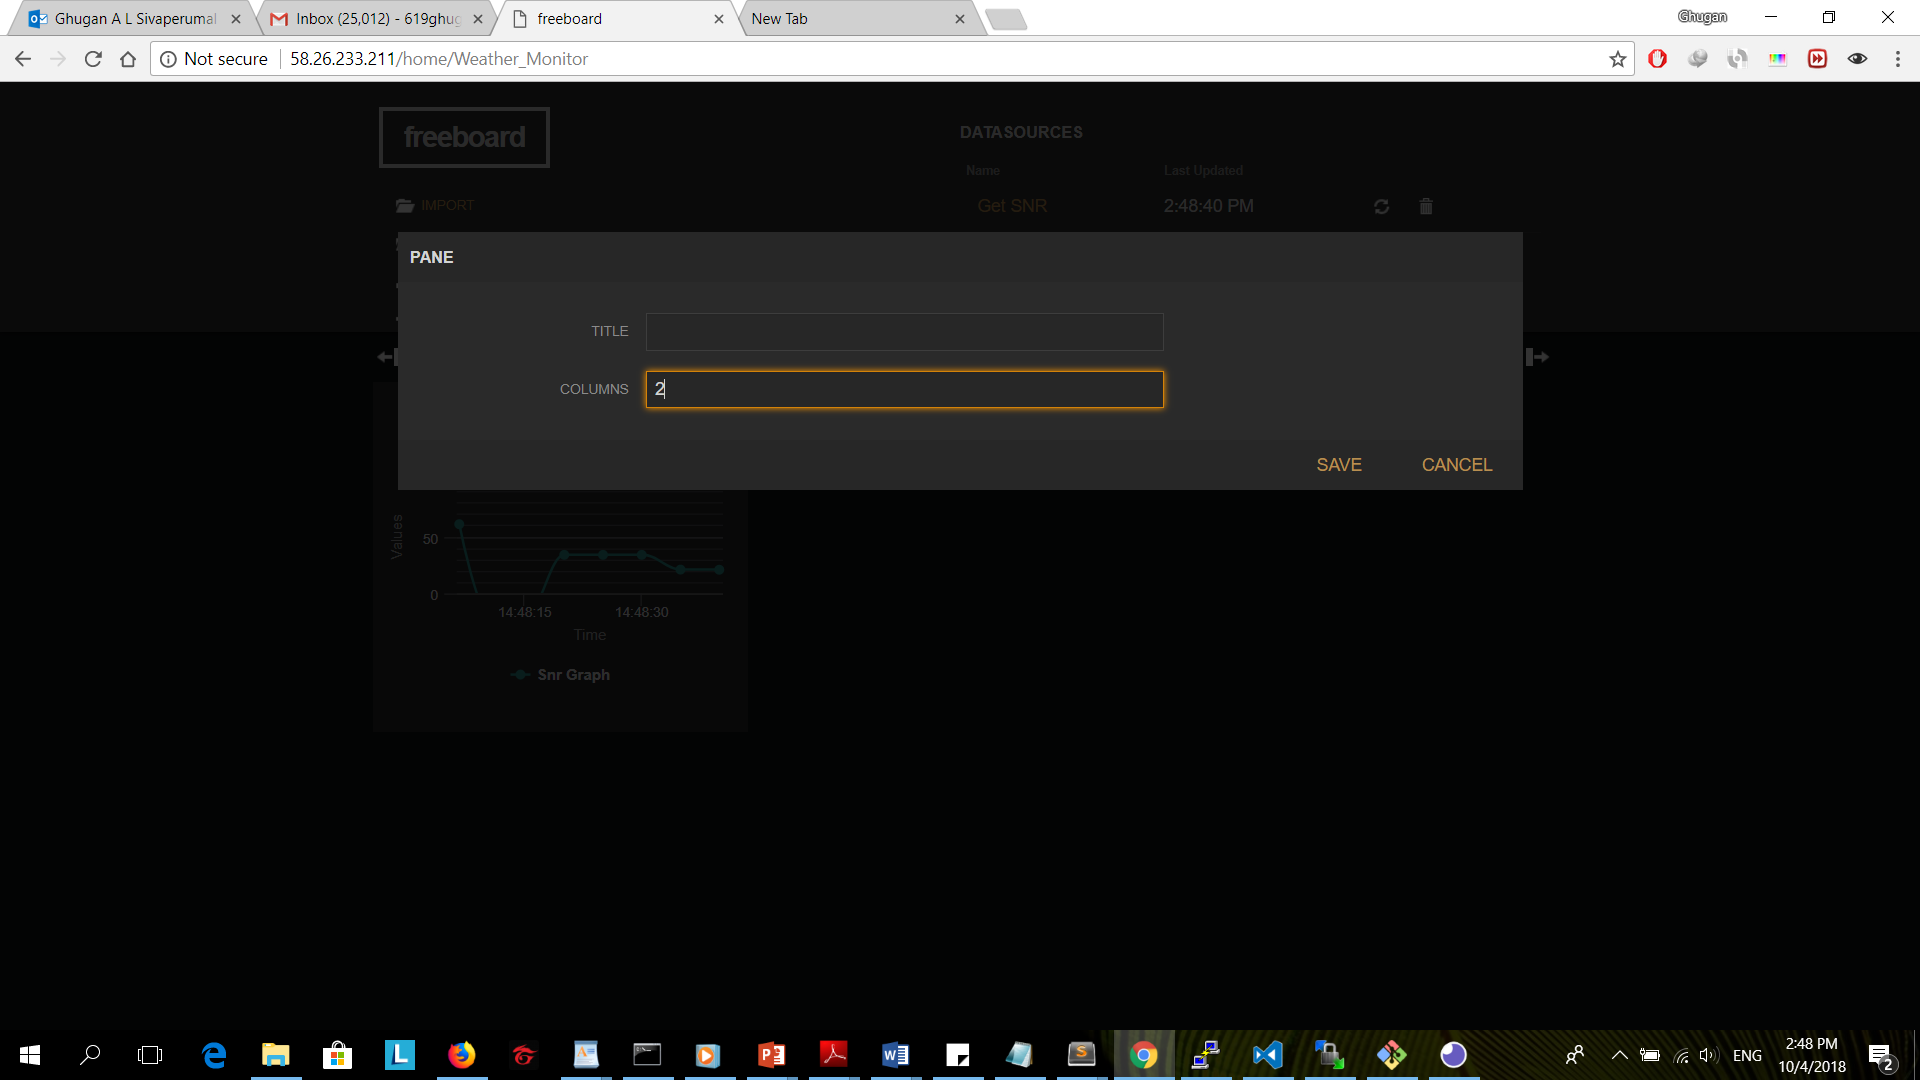
Click on Setting icon to adjust the width of the widget panel.
Add a title and select the column width to 3.
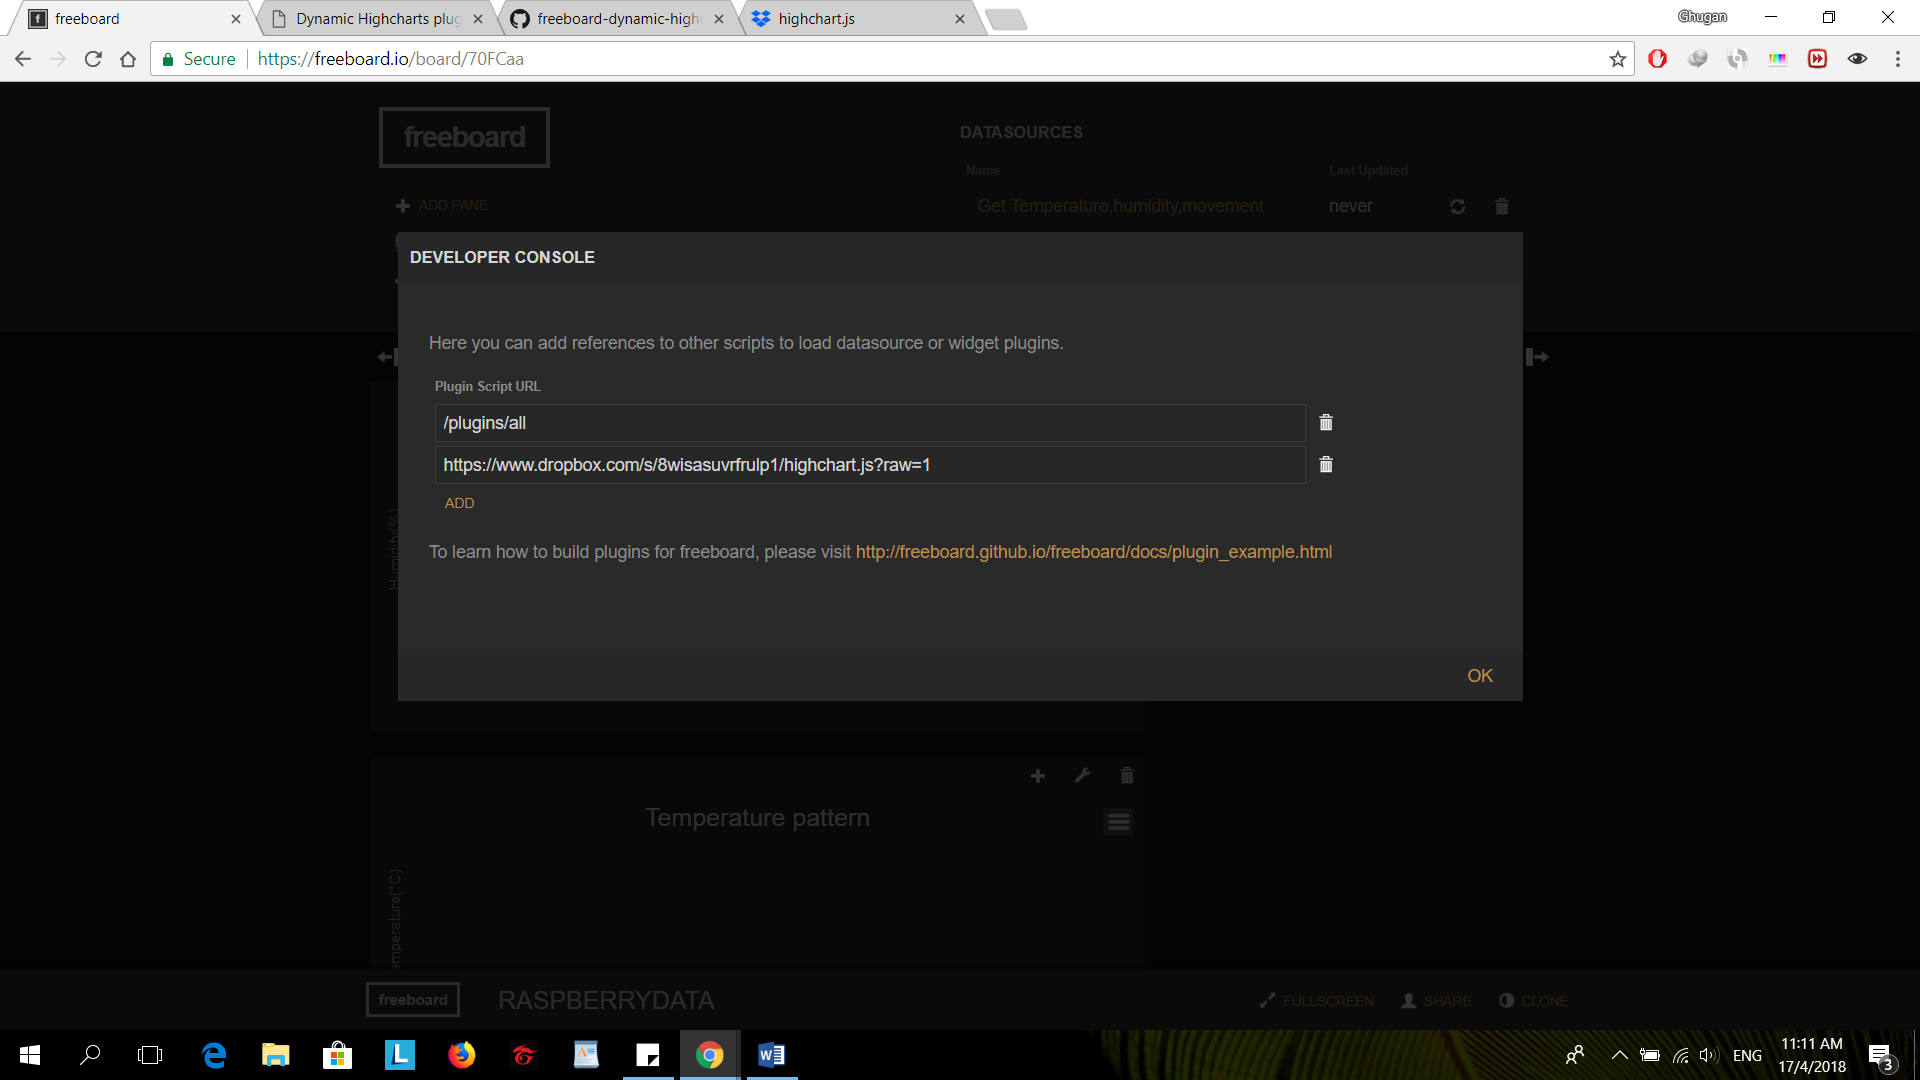
Click on Developer console to import a time series highchart into you freeboard. Click on Add and paste the following link https://www.dropbox.com/s/8wisasuvrfrulp1/highchart.js?raw=1 and click ok.
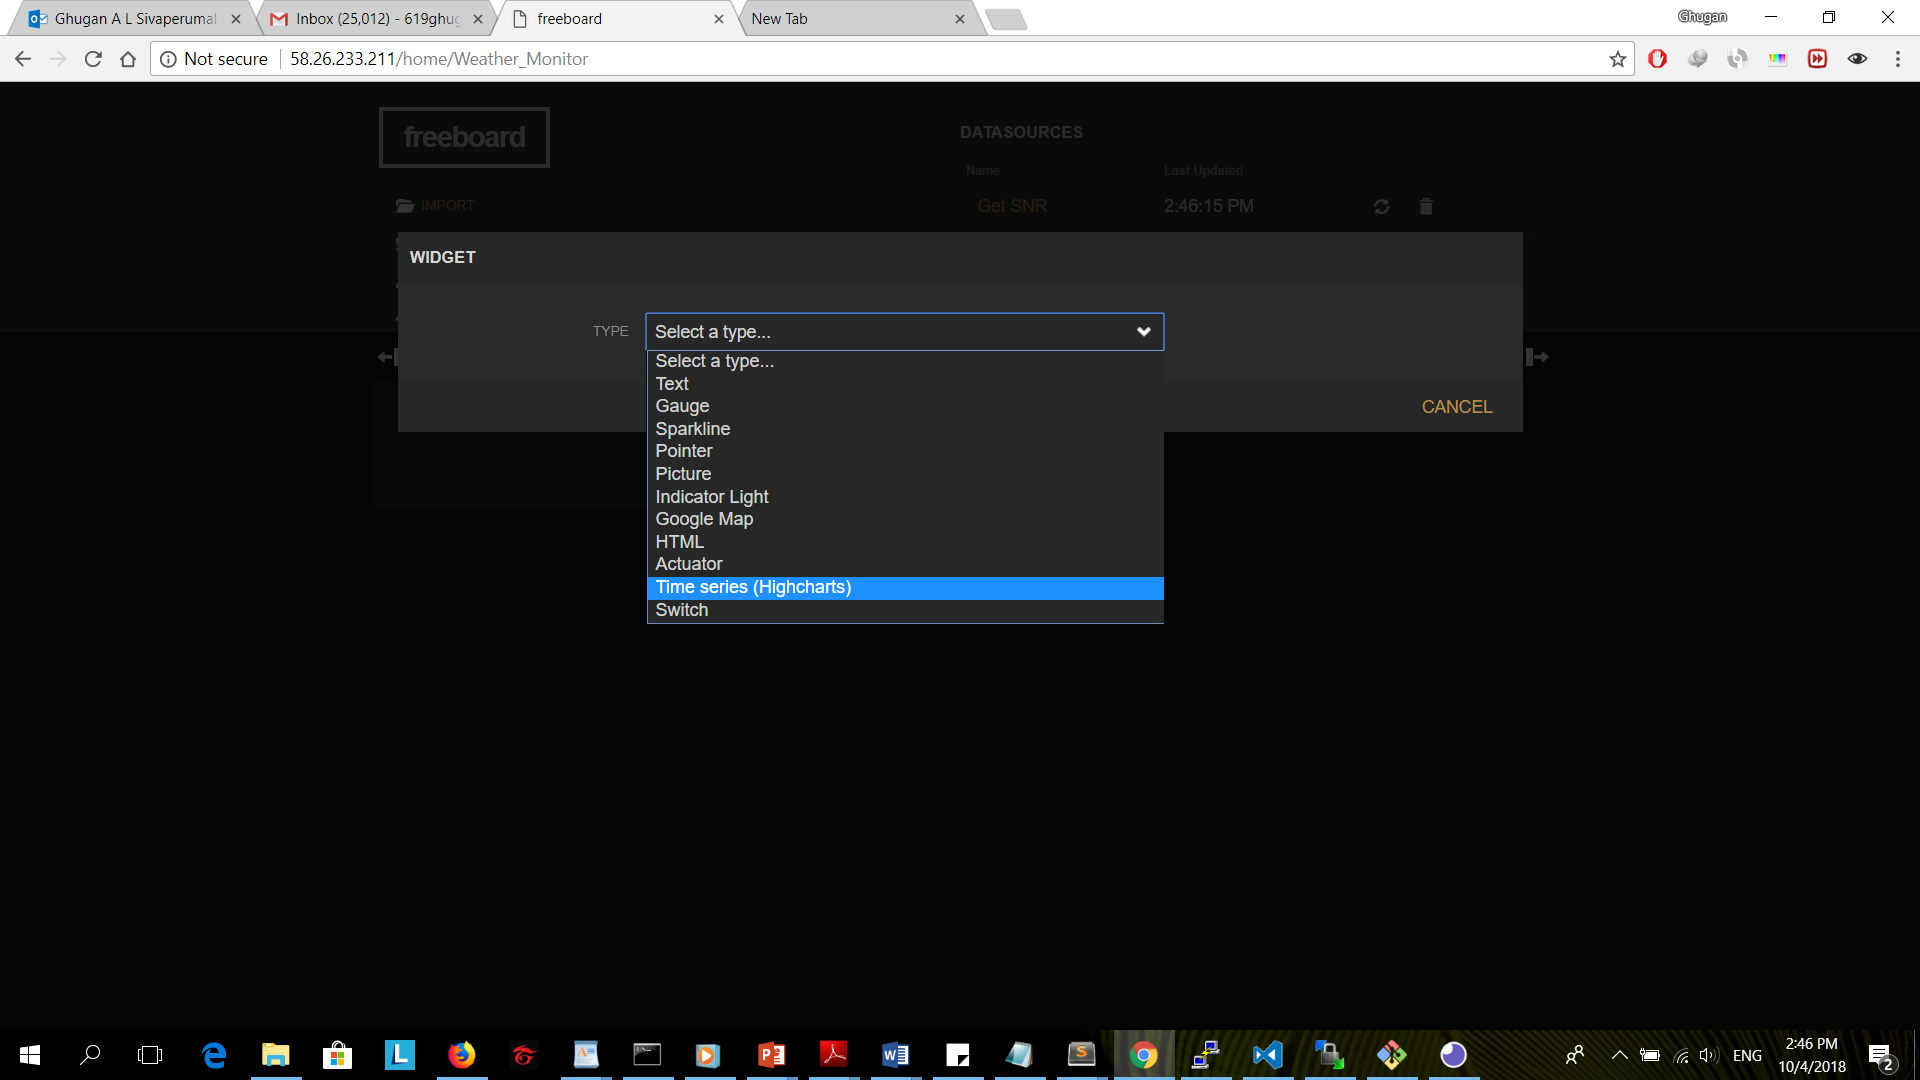
The widget size is extended now. Click on “+” icon to add the widget type to the panel.
Select “Time series(Highcharts)” to populate a highchart widget into dashboard.
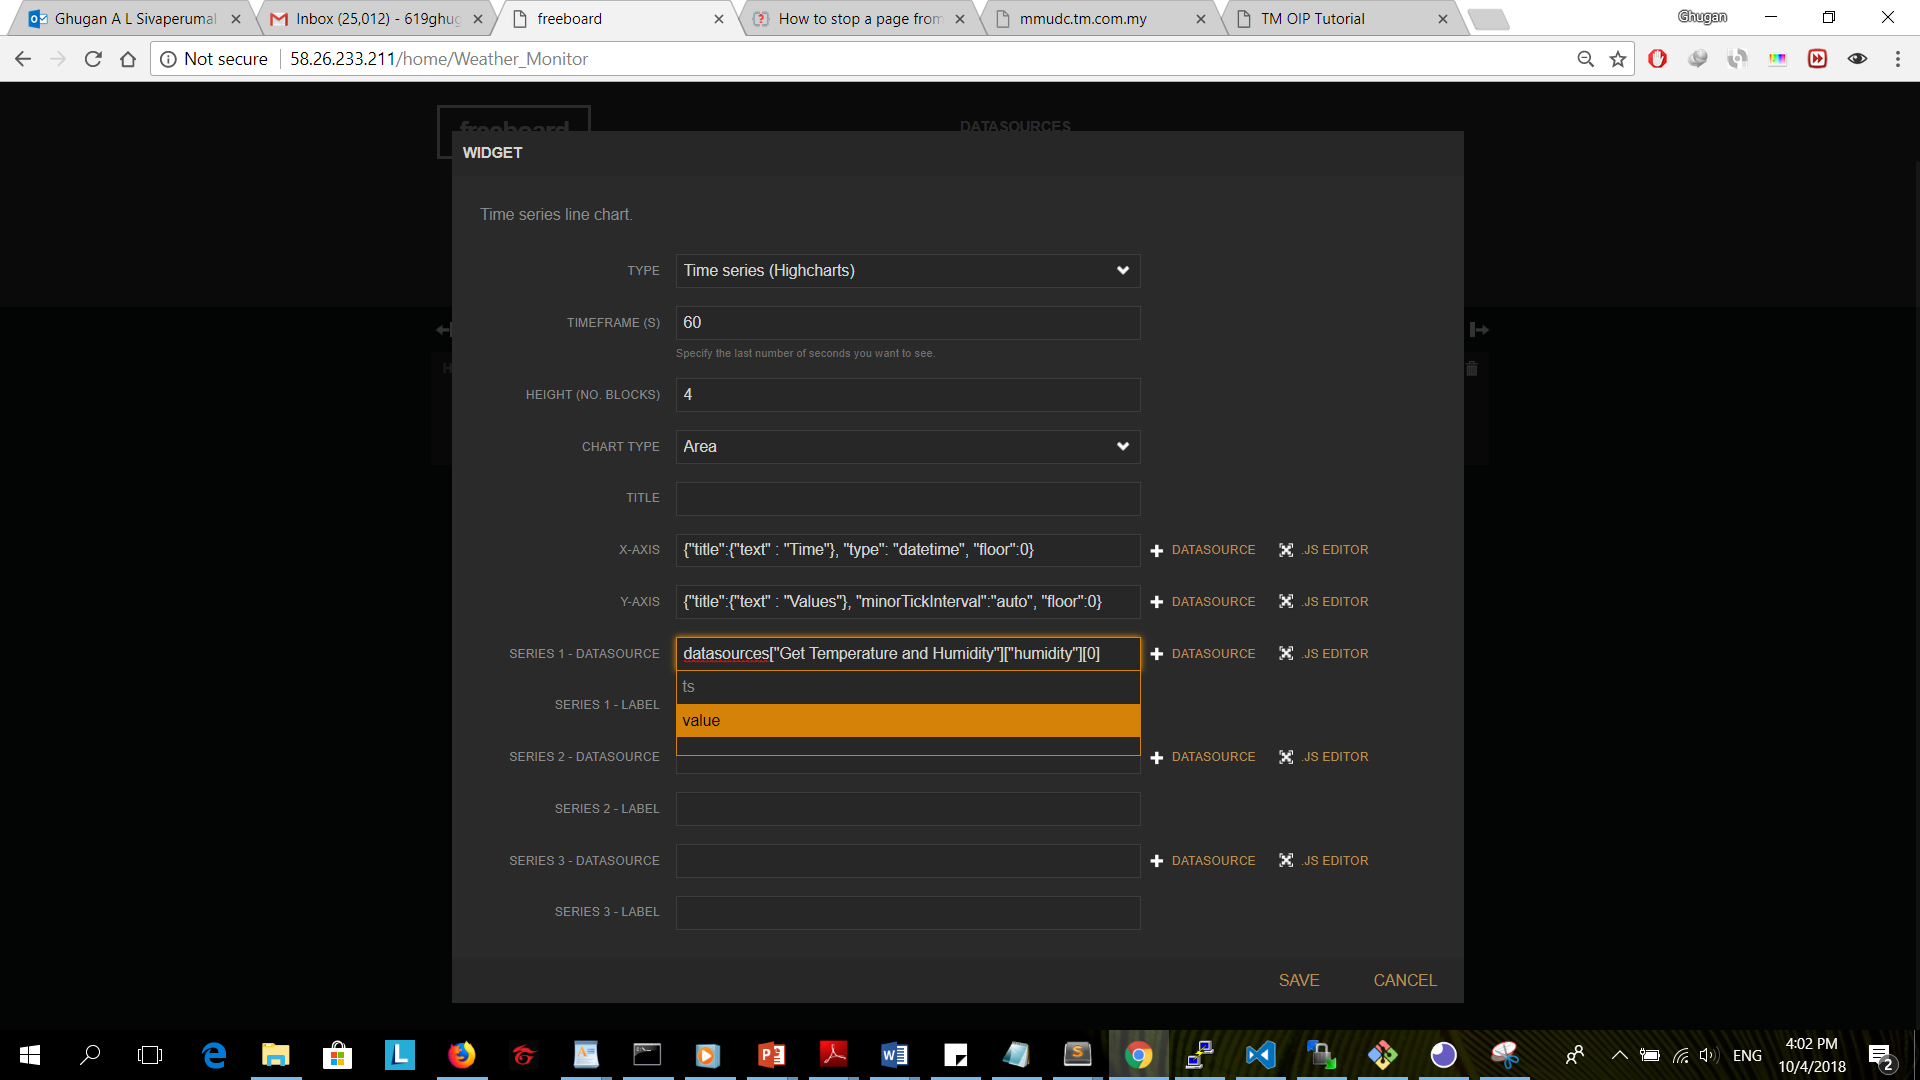
Choose the option “Spline” for the charts type and click on “+Datasources” followed by selecting Get Temperatue and Humidity > humidity > 0 > value to display the humidity rate. Repeat step 6 to 11 for adding temperature rate.
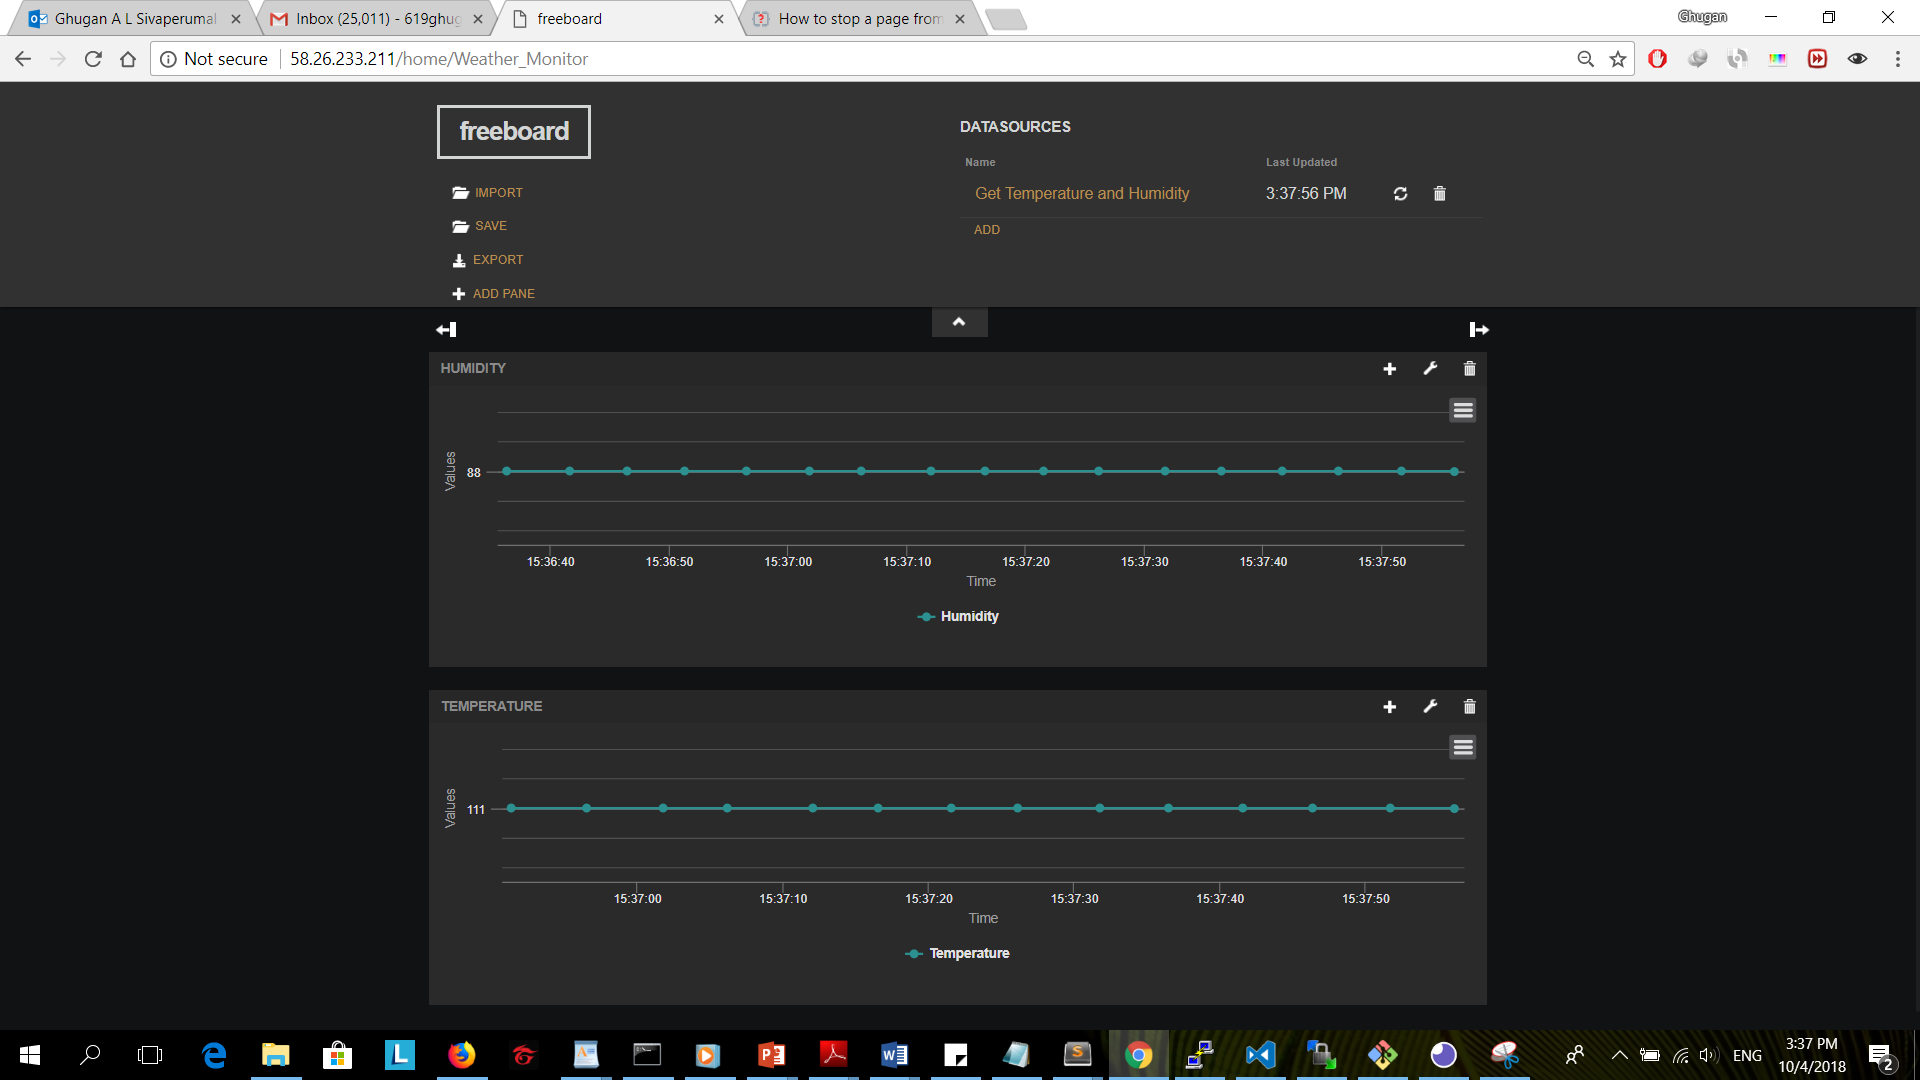
Drag the widgets to adjust the placements. To fix any resizing issue with the widgetsclick on the browsers resizing button or try refresh the page.
REST API guidelines
URL: Get Humidity and temperature
https://api.oip.tm.com.my/app/t/tmrnd.com.my/iot/1.0/api/plugins/telemetry/DEVICE/365ad9b0-16b7-11e8-ace1-e91f8f4d7baf/values/timeseries?keys=humidity,temp
METHOD : GET

PARAMETERS : keys=temperature,humidity

HEADERS
X-Authorization: Bearer <Your access token for Service creation platform>
Authorization : Bearer <Your access token for service platform>

Service Token : a7c2b5d6-f9ca-380b-aacf-d590f05aecc3
IoT Gateway with Raspberry Pi
True to being a comprehensive Service creation platform, OIP also comes with an IoT Gateway to help users integrate devices that are connected to legacy and third-party systems with the platform. With the existence of Service Manager API, users can create their own application (e.g. web application, mobile apps) to complete the end-to-end cycle of IoT system as depicted in figure:

With IoT Gateway, users can provision single device in Service creation platform for multiple appliances, i.e. one Raspberry Pi as gateway will handle multiple home appliances e.g. down light, aircond rather than making multiple devices provisioned in the server. This allows users to create their own intelligence inside gateway as well as making it easier for the scattered appliances to communicate with centralized controller.

Running the Gateway using Python
In this tutorial, you will learn on how to make use of Python script to
- publish telemetry data stream to server
- publish attribute data to server
subscribe rpc call from server to gateway
Make sure that python is already installed. Next, if
pip toolis not yet installed, do so by typingsudo apt-get install python-pip. If yes, skipped to installingpaho-mqtt# get paho-mqtt python package via pip $ sudo pip install paho-mqtt
MQTT in Python
This example shows how MQTT communication is made in most basic way. You will need to modify OIP_HOST constant to match your Service creation platform installation IP address or hostname.
The value of ACCESS_TOKEN constant corresponds to your provisioned device.
 import os
 import sys
 import paho.mqtt.client as mqtt
 import json

 OIP_HOST = 'iot.oip.tm.com'
 ACCESS_TOKEN = '<put-access-token-here>'

 def on_connect(client, userdata, rc, *extra_params):
     print('Connected with result code ' + str(rc))

 client = mqtt.Client()
 client.on_connect = on_connect
 client.username_pw_set(ACCESS_TOKEN)
 client.connect(OIP_HOST, 1883, 60)

 try:
    client.loop_forever()
 except KeyboardInterrupt:
    print('Interrupt!')
To make maintaining the scripts much easier, the OIP_TOKEN and ACCESS_TOKE should be kept inside config file. You can refer config.json to view the structure.
Since we need to use config.json as the scripts' configuration, we need to add
 # read data from config file. json only
 with open('config.json') as json_data_file:
     data = json.load(json_data_file)

 OIP_HOST = data['OIP_HOST']
 ACCESS_TOKEN = data['ACCESS_TOKEN']
The Access Token is available in Service creation platform Device menu. After finding your device, go to 'Copy Access Token' and paste it in the variable value.
Publishing Telemetry and Attribute data
Next, to publish Telemetry and Attribute data, MQTT client function publish must be called.
 # publishing telemetry data to Device in Service creation platform
 client.publish('v1/devices/me/telemetry', json.dumps({'temperature':27.0, 'humidity':20}), 1)

 # publishing attribute data to Device in Service creation platform
 client.publish('v1/devices/me/attributes', json.dumps({'model':'MiLight','version':'2.0'}), 1)
An example of a dummy sensor reading published through MQTT can be found here To run the above script, you need to type
$ python sensors_read.py Make sure Python is available, as well as Paho MQTT inside your machine.
An example of a running script:

You can view the telemetry data stream in your provisioned device inside Service Creation platform. Examples as shown below.
Telemetry data stream

Attribute data

RPC command via MQTT Subscribe
Attached sample python application for RPC call to control MiLight light bulb control_milight.py
There are lots of third-party appliances commercially available off the shelf in market. This tutorial will use MiLight as an example. For the competition, however, MiLight bulb would only be used for demo purposes and will not be provided to the participants. To learn more about MiLight, click here.
In order for RPC command to be sent to the gateway, we need to subscribe to the topic related to rpc.
# listening to any calls for rpc request when connection established
def on_connect(client, userdata, rc, *extra_params):
  print('Connected with result code ' + str(rc))
  client.subscribe('v1/devices/me/rpc/request/+')
Any request made through the topic mentioned will trigger on_message function to be called.
# triggered upon request made through the topic
def on_message(client, userdata, msg):
# any data sent inside the Body of an API call will be stored inside msg.payload
 print 'Topic: ' + msg.topic + '\nMessage: ' + str(msg.payload)

 # this data is in form of json. need to load it before we put it inside variable
 data = json.loads(msg.payload)

 # example Body: {'method':'getLightStatus'}
 if data['method'] == 'getLightStatus':
     client.publish(msg.topic.replace('request', 'response'), json.dumps({'state':'on'}), 1)

...

# after client declared. when mqtt connected, use function on_connect.
client.on_connect = on_connect
# upon receive any message especially from subscribed topic, use function on_message
client.on_message = on_message
Another example combining both the script can be downloaded here: sensors_milight.py To run the above script, you need to type
$ python sensors_milight.pyExample when execute the sample python script sensors_milight:

REST API for Telemetry, Attribute and RPC
To perform any API transaction, we need to have the corresponding tokens first.
| $SERVICE_MANAGER_TOKEN | a7c2b5d6-f9ca-380b-aacf-d590f05aecc3 |
POST : Authentication
URL:
https://api.oip.tm.com.my/app/t/tmrnd.com.my/iot/1.0/api/auth/login
 METHOD : POST

 HEADERS
    Content-Type: application/json
    Authorization: Bearer $SERVICE_MANAGER_TOKEN

 BODY
    {
        "username": <email>,
        "password": <password>
    }

 RESPONSE
     {
        "token": $JWT_TOKEN,
        "refreshToken": $REFRESH_TOKEN
     }
Token received in response $JWT_TOKEN shall be used for further API call.
GET Telemetry: Humidity, temperature, movement
To get Device Id, copy it from provisioned device page.
URL:
https://api.oip.tm.com.my/app/t/tmrnd.com.my/iot/1.0/api/plugins/telemetry/DEVICE/<Device ID>/values/timeseries?keys=humidity,temperature,movement
 METHOD : GET

 PARAMETERS : keys=humidity,temperature,movement
            (get historical data)
            : &startTs=<timestamp>&endTs=<timestamp>&interval=2000&limit=30&agg=NONE

 HEADERS
     Accept: application/json
     X-Authorization: Bearer $JWT_TOKEN
     Authorization : Bearer $SERVICE_MANAGER_TOKEN

 RESPONSE
    {
        "humidity":[
            {
                "ts":1519367888261,
                "value":"20"
            }, ...
        ],
        "temperature":[
            {
                "ts":1519367888261,
                "value":"23.92"
            }, ...
        ],
        "movement":[
            {
                "ts":1519367888261,
                "value":"false"
            }, ...
        ]
    }
In order to see the data stream, please make sure the Python script for sensor_read.py or sensor_milight.py is running. For historical data, expect multiple JSON object inside array.
POST RPC: Turn Light ON
To run RPC call, first make sure the Python script for sensor_milight.py is running in Raspberry Pi and MiLight is available. Otherwise you will find the API call will be TIMEOUT after a time or the script will show MiLight help command in Pi.
URL:
https://api.oip.tm.com.my/app/t/tmrnd.com.my/iot/1.0/api/plugins/rpc/oneway/<Device ID>
  METHOD : POST

  HEADERS
      Content-Type: application/json
      X-Authorization: Bearer $JWT_TOKEN
      Authorization : Bearer $SERVICE_MANAGER_TOKEN

 BODY
    {
        "method":"setLightStatus",
        "params":{
            "zone":"1",
            "state":"on",
            "value":""
        }
    }
RPC command will not return any response, except for status code (i.e. 200: Success). When requesting RPC call, you should read the status code to know if the request is success or fail.
User Application Example
As you have read the tutorial, it is expected that you can create application(s) that would represent your idea realized through OIP platform. Figure shows an example on how you can mesh together your created system into a web application:

The web application make use of the APIs to create controlling mechanism for the light along with presenting data stream in a graph. This simple web was created using available tools that can be downloaded from Internet, e.g. Bootstrap, JQuery and Javascript.
Demo Account for Testing
If you want to test the OIP platform you can use the following email and password in the tutorial:
username : demo@mmu.edu.my
password : Demo_123
Sign Up
Visit Service Createion platform and click on signup on top right corner.

On clicking Signup button you will be directed to https://signup.oip.tm.com.my/store/. Enter the required information to register your account and start using Open Innovation Platform.

Contact Us
If you are facing any technical issue while using the OIP platform, please contact us at oip@tmrnd.com.my